
“Just check what the neighbour sold for” is popular pricing advice. It's also incomplete. Unless you know when that home sold, what the buyer purchased and how it compares with yours, its sold price can send you towards the wrong listing or offer strategy.
MLS sold prices are evidence, not ready-made valuations. For a Vancouver condo, townhome or detached home, the useful work starts after you find the number: date it, identify the property type, verify the record and adjust for meaningful differences.
An MLS sold price is the final price of an individual sale. Once completion is confirmed, it's accurate evidence for that property and transaction, but it isn't a market reading by itself. Think of it as a photograph of a moving crowd: useful for what it shows, not a map of where everyone is going.
There's also a distinction between a listing reported as sold and a transaction that has completed. Before treating a record as a completed comparable, confirm its status and which date the record displays. An agreement date and a closing date answer different questions.
The MLS Home Price Index benchmark represents a typical home with fixed characteristics. It's designed to help you follow market direction without treating every change in the mix of homes sold as a change in value.
An assessed value answers another question. BC Assessment's valuation and sales guidance explains that an annual assessment estimates market value as of July 1, rather than the property's current market value. That makes it a tax reference and background check, not an automatic asking price.
Sold prices, benchmarks and assessments compared
A strong sale-to-list ratio doesn't automatically mean strong appreciation. A seller can deliberately choose an asking price below the expected selling range, while another seller may begin above it. The ratio describes the relationship between those particular prices, not the buyer's savings against an independently established value.
Days on market needs similar care. Look for price changes and earlier listing attempts before deciding that a home attracted immediate interest or struggled to sell.
Price per square foot is a useful cross-check, but it doesn't make layouts interchangeable. A compact apartment with usable rooms and a larger apartment with extensive circulation space can offer different utility to buyers.
Keep the sold price paired with its transaction date, and identify what that date means. Public registration, contract formation and completion shouldn't be treated as interchangeable timing markers.
Before making adjustments, complete the record or flag the gap. An unexplained blank in parking, interior area or condition can change which comparable deserves the most weight.
Compare condos with condos, townhomes with townhomes and detached homes with detached homes. The February 2026 Greater Vancouver REALTORS® market report reported an apartment benchmark of $708,200, against a composite benchmark of $1,100,300. Neither figure is an individual condo's sold price.
The adjustment question is specific: What would this comparable have sold for if it had the subject home's relevant characteristics? That means adjusting the comparable towards the subject, not adding every attractive feature to your own hoped-for price.
The comparison needs both transaction evidence and a careful reading of the homes.
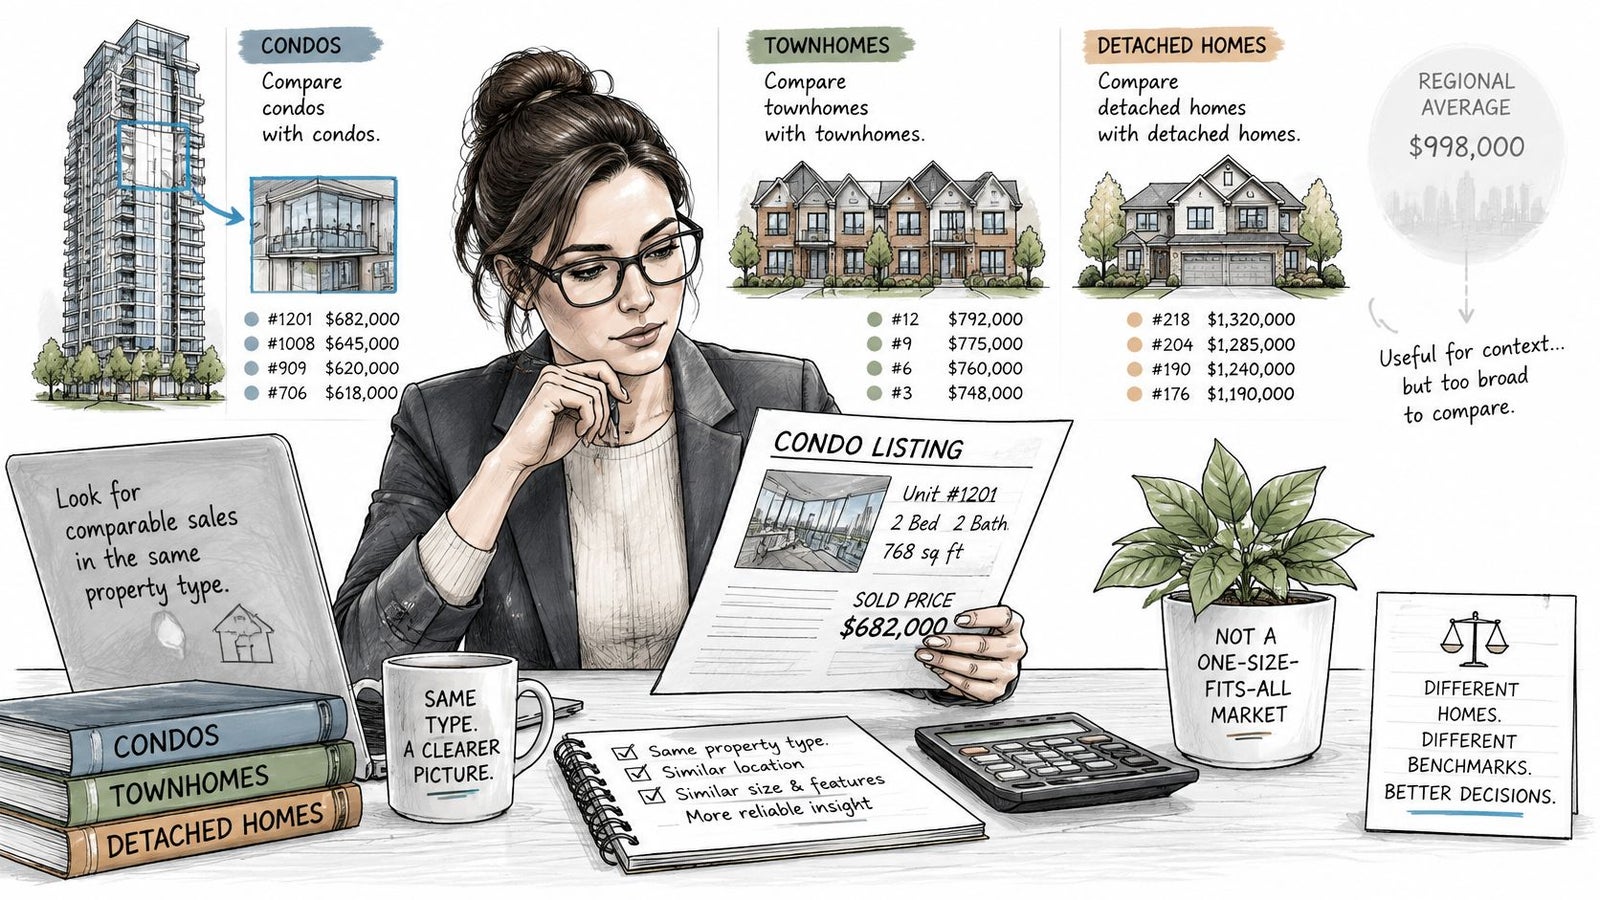
Assume the subject is an 850 sq ft, two-bedroom Westside condo, built in 2015, with one parking stall and no recent kitchen renovation. Every price, date window and adjustment below is illustrative, not market data.
For this exercise, assume four sales within the last 90 days, a marginal size adjustment of $500 per sq ft, $25,000 per parking stall and $15,000 for a recent kitchen renovation. Hold all other characteristics equal solely to show the arithmetic.
Illustrative comparables adjusted toward the subject condo
Subject: Two-bedroom condo built in 2015, with one parking stall.
Comparable A: One parking stall.
Comparable B: No parking stall.
Comparable C: One parking stall and a recent kitchen renovation.
Comparable D: Two parking stalls.
Private transactions need careful handling. A sale that never entered MLS won't appear in an MLS-only search, but its absence does not mean the sale never happened. Public records may help identify a transfer; investigate its terms and property condition before treating it as a comparable.
A recorded transfer also does not show whether unrelated parties negotiated openly under ordinary conditions. Check the context rather than assuming every public sale reflects the same exposure and bargaining process.
An older sale may be the closest architectural match for a distinctive home. Excluding it automatically could discard useful evidence; carrying its price forward unchanged could be just as misleading.
Keep it as supporting evidence, flag the timing limitation and compare it with more recent local transactions. Avoid applying a regional benchmark change mechanically to the whole property price. The subject's neighbourhood and property segment may have moved differently.
Condition can also distort a comparison. Listing photos show finishes, not the quality of concealed work. Renovation cost does not equal resale value. If you can't verify a feature, identify that uncertainty rather than presenting an adjustment as certain.
A sold price remains useful when you date it, identify the property type and state its limitations beside the comparison.
A useful pricing review ends with an explanation you can question, not just a suggested asking price. Our approach starts with the property type and neighbourhood, then examines size, age, condition, parking and strata fees before testing the adjusted evidence against benchmark direction and competing inventory.
The deliverable should be a documented comparable-sales review: the transactions used, the reason for including or excluding them, the material adjustments and the supported range. You should be able to distinguish a verified fact from an assumption and understand which comparable carries the most weight.
BC Assessment's Monthly Sales Report includes the previous three months of new or changed transactions and, where available, the previous two transactions for each property, with Vancouver identified as area code 09, as described in Greater Vancouver REALTORS® guidance on sales research. That history can prompt useful questions about a resale, but it doesn't explain whether renovations, transaction terms or changing conditions caused the difference.
Use the public-record checks in the retrieval workflow to support the review. The client-facing result should explain the evidence, rather than hand over an unexplained export.
Our Online Home Value Report offers a starting point for an estimate. It doesn't remove the need to examine condition, building particulars and the differences that affect a property-specific range.
Our explanation of what a comparative market analysis includes helps you assess that deliverable. The decision should reflect your goals, not merely a preference for the largest number.
Seller services begin with understanding those goals and extend through home preparation, pricing, marketing, private showings, offer strategy and skilled negotiation. Request a property-specific comparative market analysis before setting a list price or writing an offer, and have the supported range confirmed in writing.
Jacky Levi - Vancouver Realtor offers MLS-based pricing analysis and seller and buyer representation across Greater Vancouver, connecting comparable sales with property condition, buyer demand and competing listings. Visit Jacky Levi - Vancouver Realtor to request a property-specific comparative market analysis and discuss a documented list-price or offer range for your home.
Ask AI to rewrite this article…
MLS sold prices are evidence, not ready-made valuations. For a Vancouver condo, townhome or detached home, the useful work starts after you find the number: date it, identify the property type, verify the record and adjust for meaningful differences.
MLS Sold Prices Compared With Benchmarks and Assessments
An MLS sold price is the final price of an individual sale. Once completion is confirmed, it's accurate evidence for that property and transaction, but it isn't a market reading by itself. Think of it as a photograph of a moving crowd: useful for what it shows, not a map of where everyone is going.
There's also a distinction between a listing reported as sold and a transaction that has completed. Before treating a record as a completed comparable, confirm its status and which date the record displays. An agreement date and a closing date answer different questions.
Identify the number before interpreting it
The MLS Home Price Index benchmark represents a typical home with fixed characteristics. It's designed to help you follow market direction without treating every change in the mix of homes sold as a change in value.
An assessed value answers another question. BC Assessment's valuation and sales guidance explains that an annual assessment estimates market value as of July 1, rather than the property's current market value. That makes it a tax reference and background check, not an automatic asking price.
Sold prices, benchmarks and assessments compared
- MLS sold price: The final price of one completed sale, dated using the sale or closing date confirmed in the record. Use it as a direct comparable for a list or offer price.
- MLS HPI benchmark: The typical price for a home with fixed characteristics, reported monthly. Use it to follow trends and market direction.
- BC Assessment assessed value: An estimate of market value as of July 1. Use it as a tax reference, not a current list price.
- BC Assessment recent sales: Recorded sale dates and prices for the last three full calendar years. Use them to verify that a comparable actually sold.
Recent-sales records provide transaction history, rather than a complete explanation of a home's condition or marketing. Their verification window and retrieval process matter, but so does recognizing what they leave out.
The September 2026 MLS HPI figures published by the Canadian Real Estate Association put Metro Vancouver's composite benchmark at $1,075,900, compared with $1,784,700 for detached homes and $682,500 for apartments. Those are different segments, not interchangeable estimates for your address.
A seller comparing a detached home with the composite could start from the wrong reference point. A condo buyer could make the opposite mistake by treating that same composite as evidence that an apartment is inexpensive.
Our guide to asking price versus selling price also separates a seller's opening position from the result of negotiation.
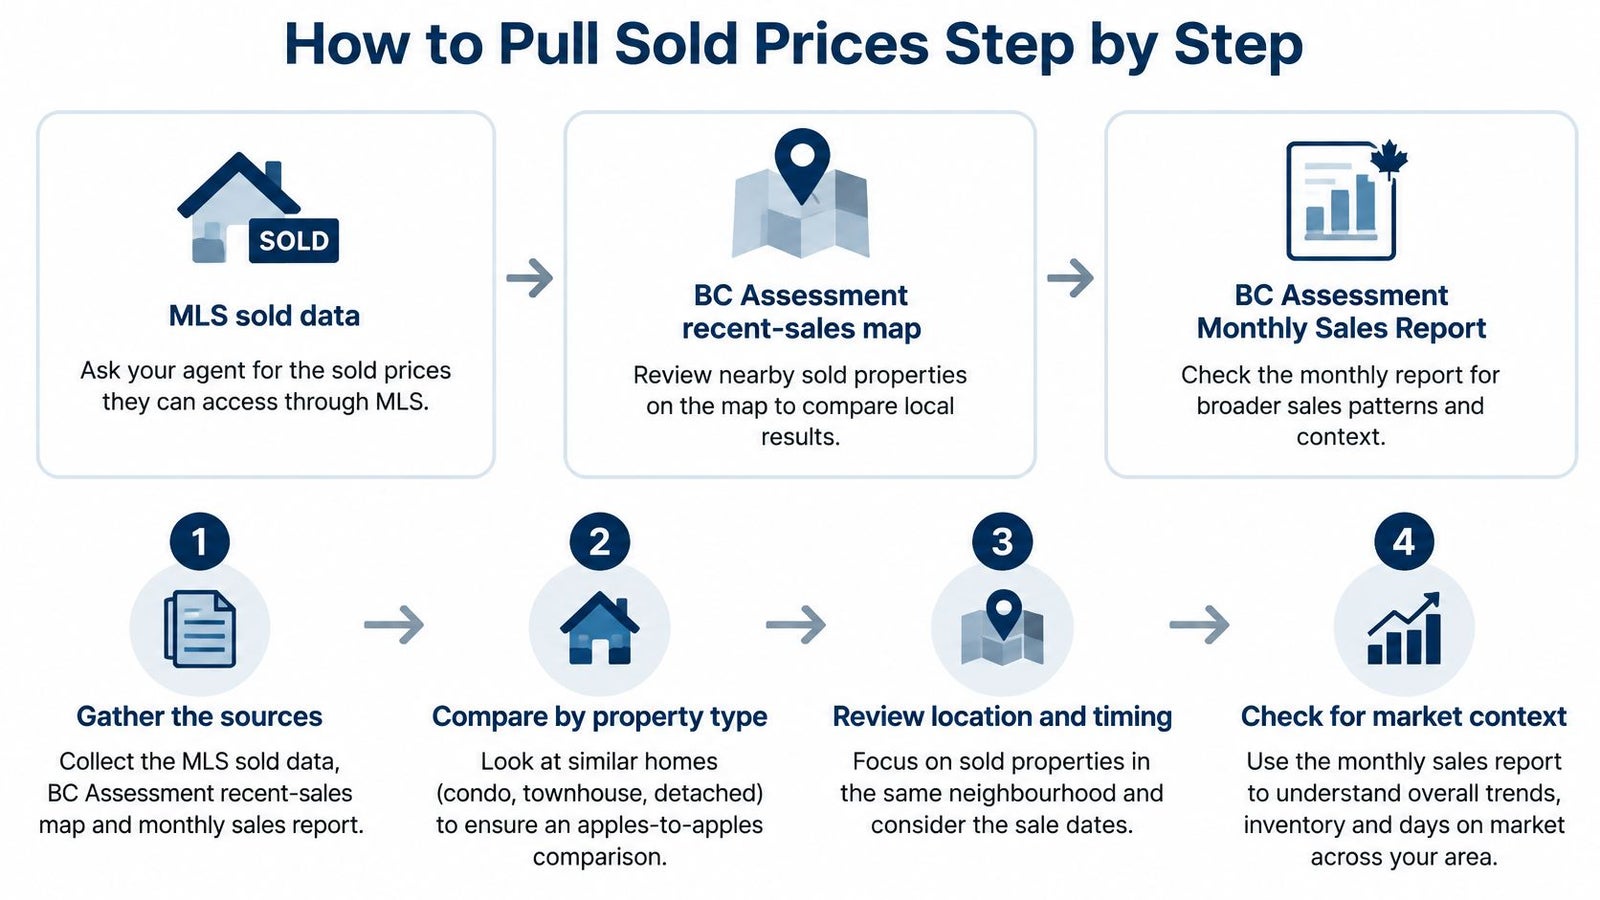
Use complementary sources: agent-accessible MLS sold records, BC Assessment's recent-sales map and BC Assessment's Monthly Sales Report. MLS records help you examine the listing and its marketing history; public records help verify the transaction.
Keep the source and retrieval date beside each entry. If two records disagree, investigate rather than choosing the figure that supports your preferred price.
This workflow keeps collection separate from interpretation.
As a practical target, aim for five to eight verified sales, rather than a large export full of weak matches. That's a working preference, not a guarantee of accuracy: a smaller, closely matched set can be more useful than a crowded spreadsheet.
For example, a condo search might initially include nearby apartments with parking and without parking. Keep those differences visible instead of averaging them away.
Our sold-properties collection provides individual property records to explore alongside a property-specific search. If you don't have MLS access, ask a licensed agent to pull the relevant sold records and use the public checks yourself.
The common slip is simple: copying the sale price without confirming its date.
A sold record is more than a headline price. Read the fields together before deciding whether the transaction belongs in your comparable set.
Sold price is the transaction figure used in the comparison. List price describes the seller's asking position, so confirm whether you're viewing the original ask or the last asking price before the sale. Confusing those fields changes the apparent negotiation result.
Sold record fields and how to check them
Match the measure to the property
The September 2026 MLS HPI figures published by the Canadian Real Estate Association put Metro Vancouver's composite benchmark at $1,075,900, compared with $1,784,700 for detached homes and $682,500 for apartments. Those are different segments, not interchangeable estimates for your address.
A seller comparing a detached home with the composite could start from the wrong reference point. A condo buyer could make the opposite mistake by treating that same composite as evidence that an apartment is inexpensive.
Our guide to asking price versus selling price also separates a seller's opening position from the result of negotiation.
Practical rule: Before drawing a conclusion, name the number you're looking at: an asking price, an individual sold price, a benchmark or an assessment.
How to Pull Sold Prices Step by Step
Use complementary sources: agent-accessible MLS sold records, BC Assessment's recent-sales map and BC Assessment's Monthly Sales Report. MLS records help you examine the listing and its marketing history; public records help verify the transaction.
Keep the source and retrieval date beside each entry. If two records disagree, investigate rather than choosing the figure that supports your preferred price.
This workflow keeps collection separate from interpretation.
Build a traceable comparable set
- Define the location. Start with the municipality and the closest relevant neighbourhood boundary. Don't cross into a different buyer market just because the home looks similar on a map.
- Select property type, sold status and timing. Keep apartments, townhomes and detached homes separate. As a working search setting, start with roughly three to six months in an active market, then widen the window deliberately if comparable transactions are scarce.
- Record the full transaction. Export or enter the address, sale date, sold price, last list price, floor area and parking. Keep listing photos and remarks where available, because the spreadsheet alone won't explain a renovation or an obstructed outlook.
- Verify the public sale history. The Greater Vancouver REALTORS® guide to checking sale history through BC Assessment describes turning on the recent-sales map layer, selecting a property, choosing “View details” and reviewing sale dates and prices for the last three full calendar years. Use that check to confirm the transaction, not to assume every listing feature has been independently verified.
- Review the Monthly Sales Report. Filter to the relevant Vancouver reporting area and check the latest new or changed transactions, together with available earlier sales. Match the property carefully, especially where a building has similar unit addresses.
- Remove weak matches and document why. Flag transactions that aren't arm's-length, are too old or differ materially in size, view or condition. A record with an unresolved issue belongs in a verification list, not inside the pricing average.
Keep the evidence manageable
As a practical target, aim for five to eight verified sales, rather than a large export full of weak matches. That's a working preference, not a guarantee of accuracy: a smaller, closely matched set can be more useful than a crowded spreadsheet.
For example, a condo search might initially include nearby apartments with parking and without parking. Keep those differences visible instead of averaging them away.
Our sold-properties collection provides individual property records to explore alongside a property-specific search. If you don't have MLS access, ask a licensed agent to pull the relevant sold records and use the public checks yourself.
The common slip is simple: copying the sale price without confirming its date.
Reading the Fields in a Sold Record
A sold record is more than a headline price. Read the fields together before deciding whether the transaction belongs in your comparable set.
Sold price is the transaction figure used in the comparison. List price describes the seller's asking position, so confirm whether you're viewing the original ask or the last asking price before the sale. Confusing those fields changes the apparent negotiation result.
Check the denominator and the history
Sold record fields and how to check them
- Sold price: The final price of one completed sale. Confirm the date and whether the sale was arm's-length before relying on it.
- List price: The last asking price before the sale. Compare it with the sold price to see how far the price moved.
- Sale-to-list ratio: The sold price divided by the last list price. Interpret it alongside sales from the same month and property type.
- Days on market: The time from listing to sale. A long run may include a price reduction before the sale.
- Price per square foot: The sold price divided by the home's size. Compare it only within the same property type.
A strong sale-to-list ratio doesn't automatically mean strong appreciation. A seller can deliberately choose an asking price below the expected selling range, while another seller may begin above it. The ratio describes the relationship between those particular prices, not the buyer's savings against an independently established value.
Days on market needs similar care. Look for price changes and earlier listing attempts before deciding that a home attracted immediate interest or struggled to sell.
A missing field is a verification task, not permission to estimate it.
Price per square foot is a useful cross-check, but it doesn't make layouts interchangeable. A compact apartment with usable rooms and a larger apartment with extensive circulation space can offer different utility to buyers.
Keep the sold price paired with its transaction date, and identify what that date means. Public registration, contract formation and completion shouldn't be treated as interchangeable timing markers.
Before making adjustments, complete the record or flag the gap. An unexplained blank in parking, interior area or condition can change which comparable deserves the most weight.
Adjusting Sold Prices With a Worked Condo Example
Compare condos with condos, townhomes with townhomes and detached homes with detached homes. The February 2026 Greater Vancouver REALTORS® market report reported an apartment benchmark of $708,200, against a composite benchmark of $1,100,300. Neither figure is an individual condo's sold price.
The adjustment question is specific: What would this comparable have sold for if it had the subject home's relevant characteristics? That means adjusting the comparable towards the subject, not adding every attractive feature to your own hoped-for price.
The comparison needs both transaction evidence and a careful reading of the homes.
Set the direction before assigning dollars
- Floor area: Deduct an evidence-supported marginal amount when the comparable is larger; add it when smaller. Don't automatically use the home's full average price per square foot as the adjustment rate.
- Age and condition: Deduct for a comparable's superior renovation when the subject is dated. Add for the reverse, while separating renovation quality from its original cost.
- Parking and storage: Adjust for usable, comparable rights and facilities. A secured stall, awkward stall and informal parking arrangement aren't equivalent.
- Outdoor space and view: Describe each home consistently, including orientation, privacy, usability and obstruction.
- Strata fees: Compare what the fees include and the buyer's total monthly cost. Don't turn the fee difference into a purchase-price adjustment without supporting evidence.
A hypothetical Westside comparison
Assume the subject is an 850 sq ft, two-bedroom Westside condo, built in 2015, with one parking stall and no recent kitchen renovation. Every price, date window and adjustment below is illustrative, not market data.
For this exercise, assume four sales within the last 90 days, a marginal size adjustment of $500 per sq ft, $25,000 per parking stall and $15,000 for a recent kitchen renovation. Hold all other characteristics equal solely to show the arithmetic.
Illustrative comparables adjusted toward the subject condo
Subject: Two-bedroom condo built in 2015, with one parking stall.
Comparable A: One parking stall.
Comparable B: No parking stall.
Comparable C: One parking stall and a recent kitchen renovation.
Comparable D: Two parking stalls.
The hypothetical calculations are:
Comparable A: A 900 sq ft unit sells for $1,050,000. Deduct $25,000 for its additional area, giving $1,025,000.
Comparable B: An 830 sq ft unit sells for $1,020,000. Add $10,000 for its smaller area and $25,000 for its missing parking stall, giving $1,055,000.
Comparable C: An 875 sq ft unit sells for $1,035,000. Deduct $12,500 for additional area and $15,000 for its superior kitchen, giving $1,007,500.
Comparable D: A 1,000 sq ft unit sells for $1,130,000. Deduct $75,000 for additional area and $25,000 for its extra stall, giving $1,030,000.
The illustrative range is $1,007,500 to $1,055,000. In a real analysis, verify each underlying sale date and price through the public record, then test the adjusted evidence against available competing homes.
Don't select the highest adjusted result just because it's appealing. Give greater weight to the homes with the closest layout, building context and condition, and explain why an outlier receives less weight.
Our Vancouver condo market analysis offers broader context for that decision. At Jacky Levi, we advise on property values, comparable sales, buyer demand, competing listings and Vancouver market conditions, setting a competitive listing price around the seller's area and current competition.
The adjustment range supports the strategy. It doesn't promise a sale at its upper end.
A sold price is a single data point, not a current value. Its usefulness depends on when the deal was negotiated, what type of property changed hands and how that home compares with the one you're pricing. The completion date can lag the agreement, so it may make older market evidence seem more current than it is.
A regional benchmark can show the direction of the market, but it cannot correct an individual comparable on its own. A peak-period sale and a later transaction are not equivalent evidence. Neighbourhood and property type matter too.
Common limits of sold-price data and how to correct them
Comparable A: A 900 sq ft unit sells for $1,050,000. Deduct $25,000 for its additional area, giving $1,025,000.
Comparable B: An 830 sq ft unit sells for $1,020,000. Add $10,000 for its smaller area and $25,000 for its missing parking stall, giving $1,055,000.
Comparable C: An 875 sq ft unit sells for $1,035,000. Deduct $12,500 for additional area and $15,000 for its superior kitchen, giving $1,007,500.
Comparable D: A 1,000 sq ft unit sells for $1,130,000. Deduct $75,000 for additional area and $25,000 for its extra stall, giving $1,030,000.
The illustrative range is $1,007,500 to $1,055,000. In a real analysis, verify each underlying sale date and price through the public record, then test the adjusted evidence against available competing homes.
Turn the range into a strategy
Don't select the highest adjusted result just because it's appealing. Give greater weight to the homes with the closest layout, building context and condition, and explain why an outlier receives less weight.
Our Vancouver condo market analysis offers broader context for that decision. At Jacky Levi, we advise on property values, comparable sales, buyer demand, competing listings and Vancouver market conditions, setting a competitive listing price around the seller's area and current competition.
The adjustment range supports the strategy. It doesn't promise a sale at its upper end.
Where Sold Prices Mislead and How to Correct Them
A sold price is a single data point, not a current value. Its usefulness depends on when the deal was negotiated, what type of property changed hands and how that home compares with the one you're pricing. The completion date can lag the agreement, so it may make older market evidence seem more current than it is.
A regional benchmark can show the direction of the market, but it cannot correct an individual comparable on its own. A peak-period sale and a later transaction are not equivalent evidence. Neighbourhood and property type matter too.
Correct the limitation rather than hiding it
Common limits of sold-price data and how to correct them
- Sales from a previous market period: They can overstate or understate current value. Give more weight to recent sales and compare the relevant benchmark trend.
- Mixed property types in one average: They distort the target price. Filter to the same property type before comparing.
- Off-market or private sales: They may be missing from MLS sold data if they were not reported through MLS. Check public records, including BC Assessment records, and treat the MLS search as incomplete.
- Unrecorded upgrades or condition: They can leave price differences unexplained. Compare condition where possible and account for renovation quality.
- Seasonal or cycle shifts: They can make a slow period look like a lasting trend. Compare sales from similar time windows.
Private transactions need careful handling. A sale that never entered MLS won't appear in an MLS-only search, but its absence does not mean the sale never happened. Public records may help identify a transfer; investigate its terms and property condition before treating it as a comparable.
A recorded transfer also does not show whether unrelated parties negotiated openly under ordinary conditions. Check the context rather than assuming every public sale reflects the same exposure and bargaining process.
Don't apply blanket corrections
An older sale may be the closest architectural match for a distinctive home. Excluding it automatically could discard useful evidence; carrying its price forward unchanged could be just as misleading.
Keep it as supporting evidence, flag the timing limitation and compare it with more recent local transactions. Avoid applying a regional benchmark change mechanically to the whole property price. The subject's neighbourhood and property segment may have moved differently.
Condition can also distort a comparison. Listing photos show finishes, not the quality of concealed work. Renovation cost does not equal resale value. If you can't verify a feature, identify that uncertainty rather than presenting an adjustment as certain.
A useful price range names its uncertainties instead of hiding them behind false precision.
A sold price remains useful when you date it, identify the property type and state its limitations beside the comparison.
Get a Sold-Data Pricing Review Before You List
A useful pricing review ends with an explanation you can question, not just a suggested asking price. Our approach starts with the property type and neighbourhood, then examines size, age, condition, parking and strata fees before testing the adjusted evidence against benchmark direction and competing inventory.
The deliverable should be a documented comparable-sales review: the transactions used, the reason for including or excluding them, the material adjustments and the supported range. You should be able to distinguish a verified fact from an assumption and understand which comparable carries the most weight.
Ask for the reasoning in writing
BC Assessment's Monthly Sales Report includes the previous three months of new or changed transactions and, where available, the previous two transactions for each property, with Vancouver identified as area code 09, as described in Greater Vancouver REALTORS® guidance on sales research. That history can prompt useful questions about a resale, but it doesn't explain whether renovations, transaction terms or changing conditions caused the difference.
Use the public-record checks in the retrieval workflow to support the review. The client-facing result should explain the evidence, rather than hand over an unexplained export.
Our Online Home Value Report offers a starting point for an estimate. It doesn't remove the need to examine condition, building particulars and the differences that affect a property-specific range.
Prepare for a pricing conversation
- Gather your property details. Bring the address, floor plan, parking and storage information, renovation details and relevant strata documents.
- Request named transactions. Ask for addresses, dates and the reason each sale belongs in the analysis.
- Review the adjustments. Ask what supports each adjustment and which uncertainties could change the conclusion.
- Test the recommendation. Compare the supported range with the relevant property-type benchmark direction and the homes buyers can choose today.
Our explanation of what a comparative market analysis includes helps you assess that deliverable. The decision should reflect your goals, not merely a preference for the largest number.
Seller services begin with understanding those goals and extend through home preparation, pricing, marketing, private showings, offer strategy and skilled negotiation. Request a property-specific comparative market analysis before setting a list price or writing an offer, and have the supported range confirmed in writing.
Jacky Levi - Vancouver Realtor offers MLS-based pricing analysis and seller and buyer representation across Greater Vancouver, connecting comparable sales with property condition, buyer demand and competing listings. Visit Jacky Levi - Vancouver Realtor to request a property-specific comparative market analysis and discuss a documented list-price or offer range for your home.
Ask AI to rewrite this article…