
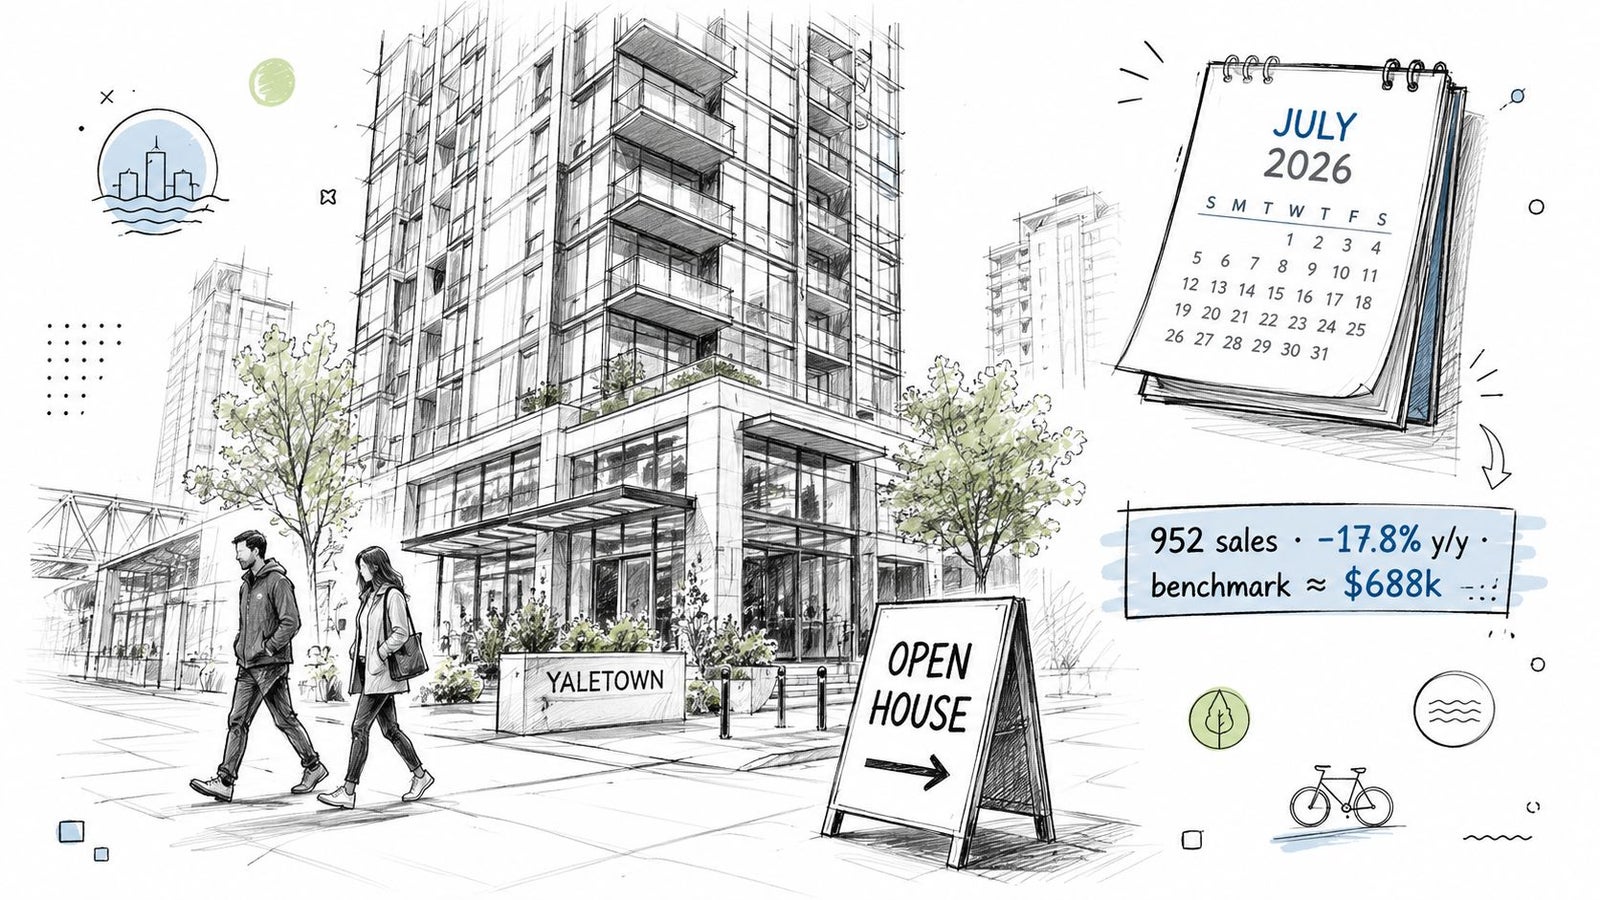
Metro Vancouver apartment sales fell 17.8% year over year in July 2026 to 952 units, while the benchmark apartment price slipped to $688,000, down 7.5%. That combination says Vancouver condo sales are weakening on both volume and price, although the effect isn't uniform across every building or neighbourhood.
For a seller, this isn't a question of whether condos are “still selling.” The more useful question is whether your building is attracting buyers at its current price, or accumulating stale listings while the regional benchmark looks relatively resilient. Buyers face the reverse problem: a lower headline price doesn't automatically mean a good purchase if the unit sits in a submarket with weak turnover, high carrying costs, or limited resale demand.
A Yaletown owner listed a condo in the spring expecting the usual sequence: strong launch exposure, several showings, then an offer after buyers compared the unit with nearby listings. Instead, the first two offers evaporated. By summer, the owner was spending weekends at open houses with thinner traffic and hearing the same question from visitors: “How flexible is the seller?”
That experience lines up with the latest regional numbers. In July 2026, Metro Vancouver apartment-condo sales totalled 952 units, compared with 1,158 in July 2025, a 17.8% year-over-year decline. The benchmark apartment price fell to $688,000, down 7.5% from the prior year, according to July 2026 Metro Vancouver apartment sales data.
Apartment benchmark
A benchmark price also isn't a simple average of every sale. It's designed to represent a typical property, so its movement can diverge from the transaction count when the mix of sold units changes. If more smaller units sell, reported dollar volume may weaken even without an equivalent shift in the benchmark. If more expensive units sell, dollar volume can rise while the number of transactions remains subdued.
The practical rule is straightforward: compare like with like. Use apartment sales for apartment decisions, keep Metro Vancouver separate from the City of Vancouver, and distinguish resale transactions from pre-sale assignments or completions. That discipline prevents a headline number from becoming a misleading offer strategy.
The 2026 pattern is more complicated than a single downward line. The available monthly picture shows apartment sales generally running below the prior year, while benchmark prices moved from the high-$700,000 range earlier in the year toward $688,000 in July.
The strongest verified early-year reference comes from February. Metro Vancouver recorded 824 apartment-home sales, down 15.6% year over year from 976 sales in February 2025. The apartment benchmark was $708,200, down 6.8% from the prior year, as reported in February 2026 Vancouver apartment condo sales coverage.
April brought 1,009 apartment-condo sales, down 10.7% year over year, while the benchmark price slipped 7.9% to $703,000, according to April 2026 Greater Vancouver condo market reporting. That combination matters because it shows transaction volume responding faster than prices. Buyers were constrained by affordability and carrying costs, but many sellers still appeared reluctant to reset expectations immediately.
July then delivered the clearest recent signal. Sales declined to 952, and the benchmark fell to $688,000. The market wasn't merely waiting for better conditions. It was clearing fewer units at lower benchmark values.
Overall residential sales in Metro Vancouver reached 1,648 in February 2026, which was 28.7% below the region's 10-year seasonal average of 2,310. That broader context supports a cautious reading of condo demand, even though the region continued to record a meaningful number of transactions.
For sellers, the 2026 sequence argues against anchoring to an older peak. For buyers, it argues against assuming every lower-priced listing is equally negotiable. The relevant question is whether a unit has recent comparable sales, competing inventory, and a buyer pool strong enough to support its asking price. A detailed 2026 Vancouver condo price analysis can help separate the benchmark trend from the local evidence.
Inventory and time on market separate a resilient price headline from the conditions sellers face. A stable median can coexist with slower showings, more choice for buyers, and longer negotiations. That gap matters because a condo that attracts no offers is competing on exposure, not just on its recorded benchmark value.
Greater Vancouver condo inventory reached 6,725 active listings in April 2026, up from 6,340 the prior month. April condo sales totalled 1,017 units, while the median condo price was $718,800, according to April 2026 BC housing market data. In May, active condo listings rose to 7,095, the median price declined to $700,000, and median price per square foot was $914. The median price fell 2.6% month over month, as reported in May 2026 Greater Vancouver housing data.
By June, Greater Vancouver condo median days on market had increased from 45 in May to 53 in June. Active condo listings stayed close to 7,095 and 7,077, respectively, while median prices remained around $700,000, according to June 2026 BC housing market reporting. For a closer examination of selling pace, see how long it takes to sell a condo in Vancouver.
The figures describe slower turnover and greater buyer choice, not a complete collapse. July's overall active listings reached 16,476, about 26.8% above the 10-year seasonal average, while the sales-to-active ratio was 13%, just above buyer-market territory, according to the July 2026 Vancouver condo inventory analysis.

Some preparation usually improves the buyer's decision process:
Timing deserves a building-specific answer. Listing during a quieter week can work if competing units are stale and your property is ready, but only when the launch creates a clear reason to act. Waiting for a perfect regional recovery can leave a seller competing against newer inventory later.
Negotiations also require preparation. Buyers may request financing conditions, document-review conditions, inspection rights, repairs, or flexible completion dates. Assignability requires particular care because it depends on the contract and the seller's comfort with the eventual party. The right response isn't to reject every condition or accept every request. It's to price the risk, set deadlines, and understand which terms protect the seller's closing certainty.
The next 90 days should look different depending on your role. The common mistake is using the same Metro-wide headline to make three different decisions.
Seller
Days 1-30: Review building-level comparables, documents, condition, and competing listings
Days 31-60: Launch with evidence-based pricing and track showing quality
Days 61-90: Reassess price and terms using actual buyer feedback and new closed sales
Buyer
Days 1-30: Identify submarkets with longer exposure and inspect strata records
Days 31-60: Compare units by total carrying cost, not price alone
Days 61-90: Write selectively, using appropriate conditions and evidence-based negotiation
Investor
Days 1-30: Model rent, strata costs, taxes, financing, insurance, and vacancy assumptions
Days 31-60: Test the property against corrected prices and realistic resale demand
Days 61-90: Decide whether the projected return compensates for building and market risk
Price to recent closed sales rather than spring 2025 expectations. Prepare for longer exposure, and front-load disclosure work so a buyer doesn't discover a concern after writing an offer. If your building already has stale competition, presentation and launch timing matter as much as the list price.
Look for units where days on market has stretched beyond the normal decision window, but don't confuse time with value. Review the Form B, meeting minutes, insurance details, depreciation report, budget, contingency reserve information, bylaws, and any special assessment discussions before treating a discount as an opportunity.
Buyers can also use the current environment to negotiate structure. A financing condition, document-review period, inspection provision, or completion date may be more valuable than a small price concession, depending on the property and the buyer's risk. The 2026 Vancouver condo buyers guide is a useful starting point, but a specific offer should reflect the actual building.
Model gross rent yield against current carrying costs rather than relying on Metro-wide appreciation. East Vancouver and suburban nodes may offer a different entry point after price corrections, but the calculation still needs realistic rent, strata fees, property taxes, insurance, financing, maintenance, vacancy, and resale assumptions. If the return only works under a future price increase, the investment case is fragile.
A slipping benchmark price can conceal meaningful building-level differences. Regional benchmark movement can mask differences in price, exposure, and buyer interest, so sellers, buyers, and investors should separate the volume story from the price story before drawing conclusions about a submarket.
Watch the upcoming September and October REBGV releases, any Bank of Canada policy shift, and strata insurance renewal cycles. These developments may affect buyer qualification, carrying costs, and owners' willingness to list, but a single month is not a reliable turning point.
Before pricing, buying, or writing an offer, review the building's recent sales alongside active and cancelled listings and days on market. That comparison shows whether inventory is clearing or stalling, even when the broader benchmark remains resilient. It also provides a firmer basis for setting an asking price, judging exposure, and choosing negotiation terms.
Jacky Levi - Vancouver Realtor offers comparative market analysis, listing preparation, professional marketing, negotiation, and transaction management for condos, townhomes, and homes across Greater Vancouver. Visit Jacky Levi - Vancouver Realtor to discuss the building-level evidence behind your next decision.
For a seller, this isn't a question of whether condos are “still selling.” The more useful question is whether your building is attracting buyers at its current price, or accumulating stale listings while the regional benchmark looks relatively resilient. Buyers face the reverse problem: a lower headline price doesn't automatically mean a good purchase if the unit sits in a submarket with weak turnover, high carrying costs, or limited resale demand.
Why Vancouver Condo Sales Are Suddenly Top of Mind Again
A Yaletown owner listed a condo in the spring expecting the usual sequence: strong launch exposure, several showings, then an offer after buyers compared the unit with nearby listings. Instead, the first two offers evaporated. By summer, the owner was spending weekends at open houses with thinner traffic and hearing the same question from visitors: “How flexible is the seller?”
That experience lines up with the latest regional numbers. In July 2026, Metro Vancouver apartment-condo sales totalled 952 units, compared with 1,158 in July 2025, a 17.8% year-over-year decline. The benchmark apartment price fell to $688,000, down 7.5% from the prior year, according to July 2026 Metro Vancouver apartment sales data.
The important point isn't that one month has delivered a definitive verdict. July can be noisy, and a single release can reflect listing timing, buyer vacations, financing decisions, and the mix of units that sold. The significance comes from the pairing: fewer transactions and a lower benchmark price. Sellers can't rely on a stable price to compensate for weaker demand, while buyers have more reason to negotiate.
That's why the broader January 2026 Vancouver real estate sales discussion needs to be read alongside later monthly releases. A transaction count tells you how many deals cleared. A benchmark price tells you how the typical qualifying property performed. Neither metric alone reveals whether a specific tower, neighbourhood, or floor plan is moving.
The phrase Vancouver condo sales sounds precise, but it can describe several different datasets. Start by identifying the property type. Apartment benchmarks generally refer to apartment-style homes sold through MLS, while the broader attached category also includes townhomes and row houses. Mixing those categories can make a market comparison look stronger or weaker than the segment you care about.Geography creates another common trap. Metro Vancouver includes the City of Vancouver and surrounding municipalities such as Burnaby, Richmond, and Coquitlam. A Metro Vancouver apartment result is therefore not the same thing as a City of Vancouver result. It may be useful for understanding regional direction, but it shouldn't be treated as a direct valuation for a Yaletown, Metrotown, or Burquitlam unit.
That's why the broader January 2026 Vancouver real estate sales discussion needs to be read alongside later monthly releases. A transaction count tells you how many deals cleared. A benchmark price tells you how the typical qualifying property performed. Neither metric alone reveals whether a specific tower, neighbourhood, or floor plan is moving.
Kitchen-table conclusion: A condo can be “selling” across Metro Vancouver while your building's comparable listings sit unsold. Regional data provides the weather report, but building-level sales history tells you whether to bring an umbrella.
What Counts as a Vancouver Condo Sale
The phrase Vancouver condo sales sounds precise, but it can describe several different datasets. Start by identifying the property type. Apartment benchmarks generally refer to apartment-style homes sold through MLS, while the broader attached category also includes townhomes and row houses. Mixing those categories can make a market comparison look stronger or weaker than the segment you care about.Geography creates another common trap. Metro Vancouver includes the City of Vancouver and surrounding municipalities such as Burnaby, Richmond, and Coquitlam. A Metro Vancouver apartment result is therefore not the same thing as a City of Vancouver result. It may be useful for understanding regional direction, but it shouldn't be treated as a direct valuation for a Yaletown, Metrotown, or Burquitlam unit.
Read the dataset before reading the trend
Apartment benchmark
- Includes: Apartment-style residential properties represented in the benchmark dataset
- Excludes: Detached homes, most townhomes, and other property types
Apartment sales count
- Includes: Reported apartment transactions for the stated geographic area and period
- Excludes: Private transactions and sales that aren't captured in the published dataset
Broader attached category
- Includes: Condominiums, townhomes, and row-house-style attached properties, depending on the report
- Excludes: Detached properties
Pre-sale and assignment activity
- Includes: Transactions or assignments where the relevant reporting system records them
- Excludes: Some assignment activity and completions that never appear as a monthly resale transaction
Dollar volume
- Includes: The total value of reported transactions in the selected group
- Excludes: Unreported or differently classified transactions
A benchmark price also isn't a simple average of every sale. It's designed to represent a typical property, so its movement can diverge from the transaction count when the mix of sold units changes. If more smaller units sell, reported dollar volume may weaken even without an equivalent shift in the benchmark. If more expensive units sell, dollar volume can rise while the number of transactions remains subdued.
The practical rule is straightforward: compare like with like. Use apartment sales for apartment decisions, keep Metro Vancouver separate from the City of Vancouver, and distinguish resale transactions from pre-sale assignments or completions. That discipline prevents a headline number from becoming a misleading offer strategy.
How 2026 Condo Sales Are Actually Trending
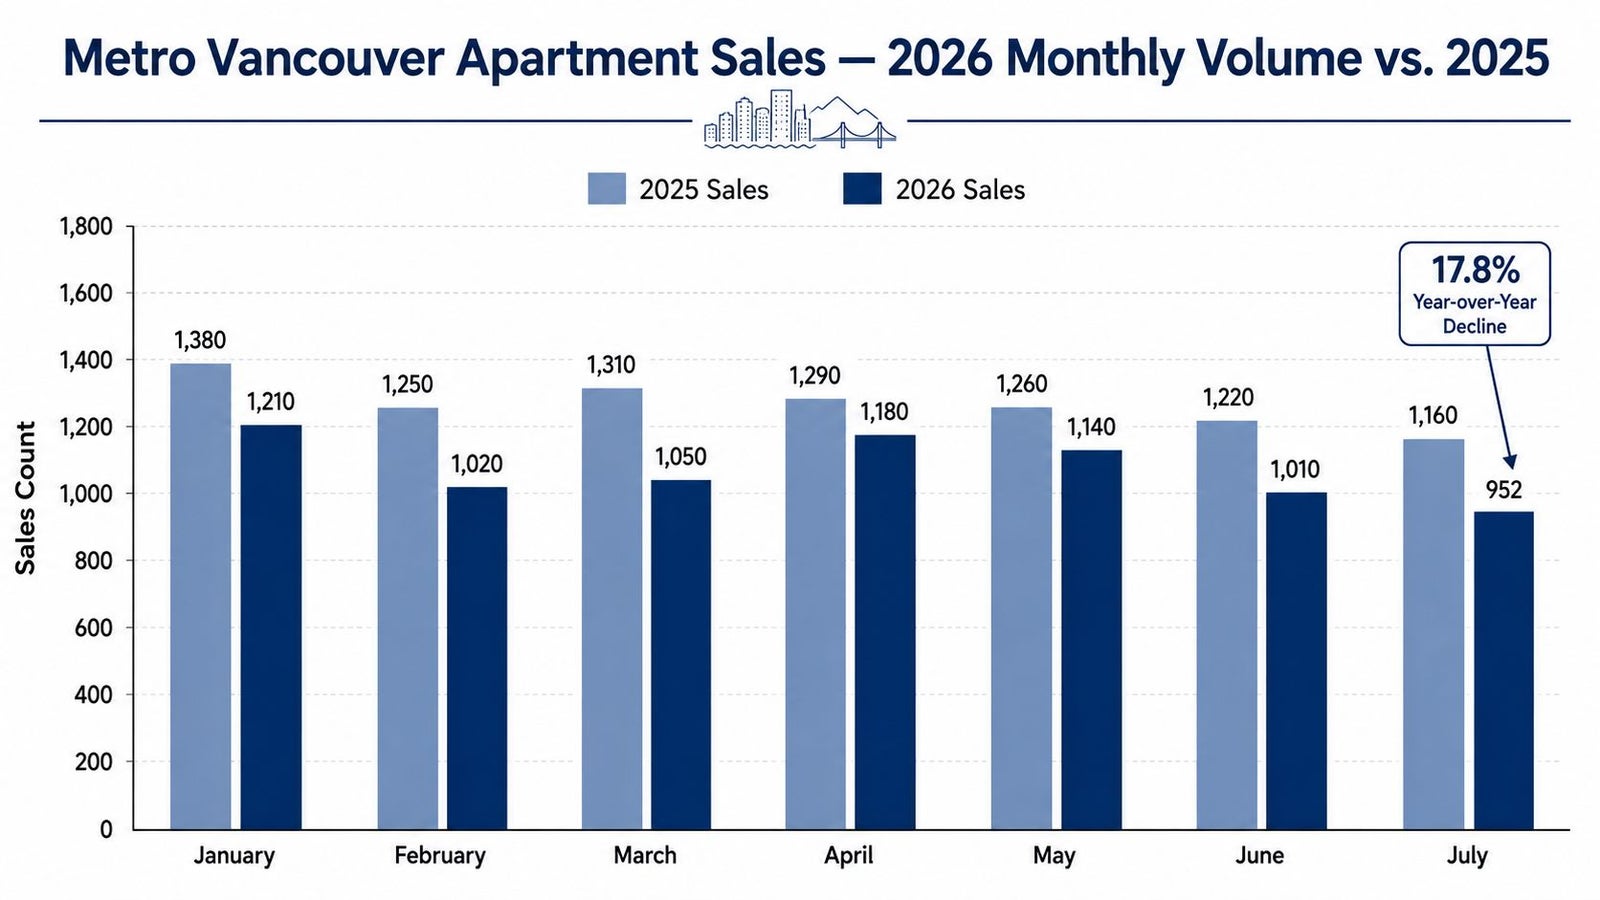
The 2026 pattern is more complicated than a single downward line. The available monthly picture shows apartment sales generally running below the prior year, while benchmark prices moved from the high-$700,000 range earlier in the year toward $688,000 in July.
The strongest verified early-year reference comes from February. Metro Vancouver recorded 824 apartment-home sales, down 15.6% year over year from 976 sales in February 2025. The apartment benchmark was $708,200, down 6.8% from the prior year, as reported in February 2026 Vancouver apartment condo sales coverage.
Volume weakened before sellers fully adjusted
April brought 1,009 apartment-condo sales, down 10.7% year over year, while the benchmark price slipped 7.9% to $703,000, according to April 2026 Greater Vancouver condo market reporting. That combination matters because it shows transaction volume responding faster than prices. Buyers were constrained by affordability and carrying costs, but many sellers still appeared reluctant to reset expectations immediately.
July then delivered the clearest recent signal. Sales declined to 952, and the benchmark fell to $688,000. The market wasn't merely waiting for better conditions. It was clearing fewer units at lower benchmark values.
That distinction changes behaviour:
- Falling sales with flat prices can reward a patient seller whose unit is differentiated and correctly positioned.
- Falling sales with falling prices puts more pressure on sellers to compete for the buyers who remain active.
- Lower sales and lower prices together also increase the cost of waiting, because a stale listing may eventually need both a price reduction and a relaunch.
- A regional benchmark decline doesn't establish that every submarket has fallen by the same amount. It's a weighted result, not a building appraisal.
Overall residential sales in Metro Vancouver reached 1,648 in February 2026, which was 28.7% below the region's 10-year seasonal average of 2,310. That broader context supports a cautious reading of condo demand, even though the region continued to record a meaningful number of transactions.
For sellers, the 2026 sequence argues against anchoring to an older peak. For buyers, it argues against assuming every lower-priced listing is equally negotiable. The relevant question is whether a unit has recent comparable sales, competing inventory, and a buyer pool strong enough to support its asking price. A detailed 2026 Vancouver condo price analysis can help separate the benchmark trend from the local evidence.
Inventory and Time on Market in Greater Vancouver
Inventory and time on market separate a resilient price headline from the conditions sellers face. A stable median can coexist with slower showings, more choice for buyers, and longer negotiations. That gap matters because a condo that attracts no offers is competing on exposure, not just on its recorded benchmark value.
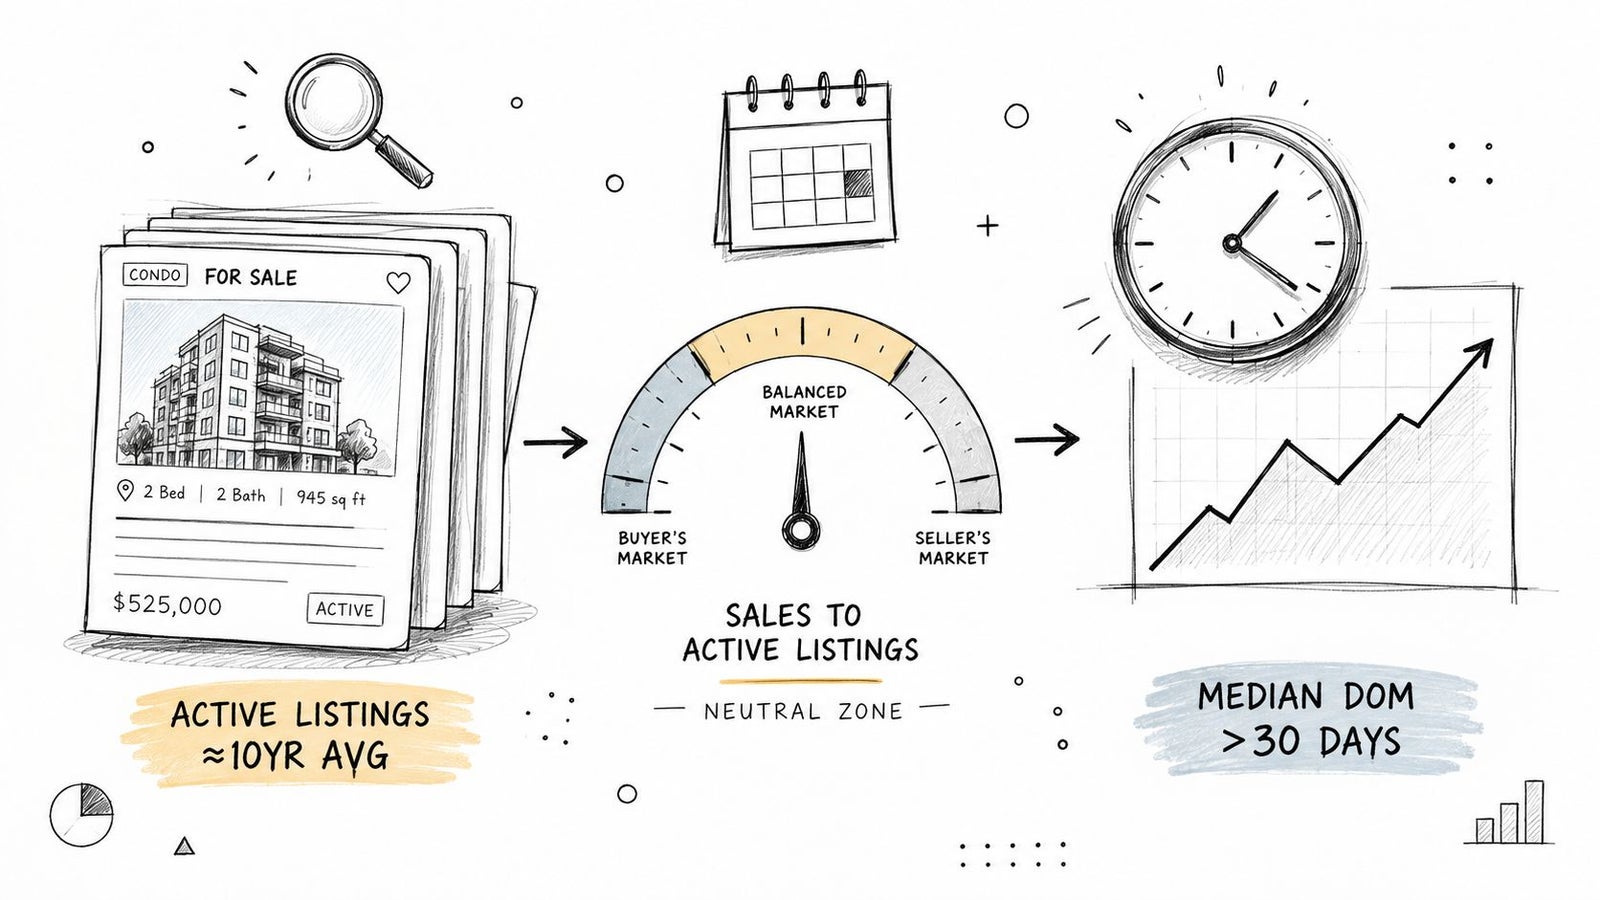
Greater Vancouver condo inventory reached 6,725 active listings in April 2026, up from 6,340 the prior month. April condo sales totalled 1,017 units, while the median condo price was $718,800, according to April 2026 BC housing market data. In May, active condo listings rose to 7,095, the median price declined to $700,000, and median price per square foot was $914. The median price fell 2.6% month over month, as reported in May 2026 Greater Vancouver housing data.
Time shifts negotiating power
By June, Greater Vancouver condo median days on market had increased from 45 in May to 53 in June. Active condo listings stayed close to 7,095 and 7,077, respectively, while median prices remained around $700,000, according to June 2026 BC housing market reporting. For a closer examination of selling pace, see how long it takes to sell a condo in Vancouver.
The figures describe slower turnover and greater buyer choice, not a complete collapse. July's overall active listings reached 16,476, about 26.8% above the 10-year seasonal average, while the sales-to-active ratio was 13%, just above buyer-market territory, according to the July 2026 Vancouver condo inventory analysis.
For a listing that reaches 60-plus days on market, the next step is evidence, not optimism:
- Compare directly: Review recent closed sales in the same building and the closest comparable buildings.
- Diagnose objections: Separate price concerns from issues involving layout, strata documents, parking, insurance, or building condition.
- Relaunch deliberately: A small reduction may not change response without stronger photography, presentation, or a clearer offer strategy.
- Protect credibility: Repeated reductions can indicate that the initial price lacked comparable-sale support.
August and September readings could change the interpretation. One month is insufficient for a long-term conclusion, but longer exposure combined with wider choice gives active buyers more room to negotiate today.
The regional benchmark is a weighted average. It can show direction without telling a seller whether a specific building is clearing inventory. Publicly verified data in the current market record doesn't provide reliable building-level benchmark prices, median days on market, or turnover status for each named submarket, so the comparison below avoids manufactured figures.
Comparing Condo Submarkets Across Vancouver
The regional benchmark is a weighted average. It can show direction without telling a seller whether a specific building is clearing inventory. Publicly verified data in the current market record doesn't provide reliable building-level benchmark prices, median days on market, or turnover status for each named submarket, so the comparison below avoids manufactured figures.
Downtown Vancouver, West End, Yaletown, Coal Harbour
- Benchmark price: Building-specific
- YoY price change: Building-specific
- Median DOM: Building-specific
- Turnover status: Must be tested against recent comparable sales
Vancouver Westside, Kitsilano, Kerrisdale, Cambie corridor
- Benchmark price: Building-specific
- YoY price change: Building-specific
- Median DOM: Building-specific
- Turnover status: Must be tested against recent comparable sales
East Vancouver, Mount Pleasant, Strathcona, Hastings-Sunrise
- Benchmark price: Building-specific
- YoY price change: Building-specific
- Median DOM: Building-specific
- Turnover status: Must be tested against recent comparable sales
Burnaby South and Metrotown
- Benchmark price: Building-specific
- YoY price change: Building-specific
- Median DOM: Building-specific
- Turnover status: Must be tested against recent comparable sales
Richmond Centre
- Benchmark price: Building-specific
- YoY price change: Building-specific
- Median DOM: Building-specific
- Turnover status: Must be tested against recent comparable sales
Coquitlam and Burquitlam
- Benchmark price: Building-specific
- YoY price change: Building-specific
- Median DOM: Building-specific
- Turnover status: Must be tested against recent comparable sales
What can be said with confidence is that the $688,000 Metro Vancouver apartment benchmark in July represents the region, not each submarket. A newer concrete unit near a transit node may attract a different buyer pool from an older wood-frame walk-up, even when both are classified as apartments. Floor plan, parking, monthly strata fees, pet rules, insurance history, depreciation reports, and remaining warranty can all affect how quickly buyers respond.
That's the gap between a market headline and a pricing decision. If newer suburban stock is receiving showings while older inventory in a particular downtown or East Vancouver pocket is lingering, the regional benchmark won't identify the difference. The agent must inspect active, expired, cancelled, and sold listings at the building level.
A practical seller should therefore ask for a submarket report that separates price movement from turnover. A building with modest price resilience but very few completed sales may be less healthy than one with a lower benchmark and consistent buyer activity.
Sellers need a sharper launch plan because the market no longer forgives an optimistic first price as easily. Start with the most recent closed comparables in your building or the nearest similar properties. Don't anchor to a 2022 peak, an old assessment, or the asking price of a competing unit that hasn't sold.
The listing package should answer buyer questions before they become negotiation points. Assemble current strata documents, financial statements, meeting minutes, insurance information, depreciation reports where available, parking details, storage information, and any records relating to major building work. In a slower market, uncertainty can cost a seller more than a cosmetic imperfection.
That's the gap between a market headline and a pricing decision. If newer suburban stock is receiving showings while older inventory in a particular downtown or East Vancouver pocket is lingering, the regional benchmark won't identify the difference. The agent must inspect active, expired, cancelled, and sold listings at the building level.
A practical seller should therefore ask for a submarket report that separates price movement from turnover. A building with modest price resilience but very few completed sales may be less healthy than one with a lower benchmark and consistent buyer activity.
What the Data Means for Condo Sellers Right Now
Sellers need a sharper launch plan because the market no longer forgives an optimistic first price as easily. Start with the most recent closed comparables in your building or the nearest similar properties. Don't anchor to a 2022 peak, an old assessment, or the asking price of a competing unit that hasn't sold.
The listing package should answer buyer questions before they become negotiation points. Assemble current strata documents, financial statements, meeting minutes, insurance information, depreciation reports where available, parking details, storage information, and any records relating to major building work. In a slower market, uncertainty can cost a seller more than a cosmetic imperfection.
Spend where buyers can feel the difference
Some preparation usually improves the buyer's decision process:
- Remove friction: Repair visible defects, improve lighting, clean windows, and make access easy for showings.
- Clarify utility: Present in-suite laundry, parking, storage, and the floor plan prominently because buyers compare practical features across competing listings.
- Address restrictions early: Pet rules, rental restrictions, age restrictions, and move-in procedures should be easy to verify.
- Avoid decorative overreach: Expensive upgrades rarely make sense if they don't solve a buyer objection or improve the unit's immediate presentation.
Timing deserves a building-specific answer. Listing during a quieter week can work if competing units are stale and your property is ready, but only when the launch creates a clear reason to act. Waiting for a perfect regional recovery can leave a seller competing against newer inventory later.
Negotiations also require preparation. Buyers may request financing conditions, document-review conditions, inspection rights, repairs, or flexible completion dates. Assignability requires particular care because it depends on the contract and the seller's comfort with the eventual party. The right response isn't to reject every condition or accept every request. It's to price the risk, set deadlines, and understand which terms protect the seller's closing certainty.
A Practical 90-Day Playbook for Buyers, Sellers, and Investors
The next 90 days should look different depending on your role. The common mistake is using the same Metro-wide headline to make three different decisions.
Seller
Days 1-30: Review building-level comparables, documents, condition, and competing listings
Days 31-60: Launch with evidence-based pricing and track showing quality
Days 61-90: Reassess price and terms using actual buyer feedback and new closed sales
Buyer
Days 1-30: Identify submarkets with longer exposure and inspect strata records
Days 31-60: Compare units by total carrying cost, not price alone
Days 61-90: Write selectively, using appropriate conditions and evidence-based negotiation
Investor
Days 1-30: Model rent, strata costs, taxes, financing, insurance, and vacancy assumptions
Days 31-60: Test the property against corrected prices and realistic resale demand
Days 61-90: Decide whether the projected return compensates for building and market risk
Sellers
Price to recent closed sales rather than spring 2025 expectations. Prepare for longer exposure, and front-load disclosure work so a buyer doesn't discover a concern after writing an offer. If your building already has stale competition, presentation and launch timing matter as much as the list price.
Buyers
Look for units where days on market has stretched beyond the normal decision window, but don't confuse time with value. Review the Form B, meeting minutes, insurance details, depreciation report, budget, contingency reserve information, bylaws, and any special assessment discussions before treating a discount as an opportunity.
Buyers can also use the current environment to negotiate structure. A financing condition, document-review period, inspection provision, or completion date may be more valuable than a small price concession, depending on the property and the buyer's risk. The 2026 Vancouver condo buyers guide is a useful starting point, but a specific offer should reflect the actual building.
Investors
Model gross rent yield against current carrying costs rather than relying on Metro-wide appreciation. East Vancouver and suburban nodes may offer a different entry point after price corrections, but the calculation still needs realistic rent, strata fees, property taxes, insurance, financing, maintenance, vacancy, and resale assumptions. If the return only works under a future price increase, the investment case is fragile.
The Numbers Behind the Headlines and What Comes Next
A slipping benchmark price can conceal meaningful building-level differences. Regional benchmark movement can mask differences in price, exposure, and buyer interest, so sellers, buyers, and investors should separate the volume story from the price story before drawing conclusions about a submarket.
Watch the upcoming September and October REBGV releases, any Bank of Canada policy shift, and strata insurance renewal cycles. These developments may affect buyer qualification, carrying costs, and owners' willingness to list, but a single month is not a reliable turning point.
Before pricing, buying, or writing an offer, review the building's recent sales alongside active and cancelled listings and days on market. That comparison shows whether inventory is clearing or stalling, even when the broader benchmark remains resilient. It also provides a firmer basis for setting an asking price, judging exposure, and choosing negotiation terms.
Jacky Levi - Vancouver Realtor offers comparative market analysis, listing preparation, professional marketing, negotiation, and transaction management for condos, townhomes, and homes across Greater Vancouver. Visit Jacky Levi - Vancouver Realtor to discuss the building-level evidence behind your next decision.