
A seller in Kitsilano or on Main Street can still price a home from memory, especially after hearing what a neighbour received or remembering the market at its peak. That approach often creates a weak opening position. Buyers compare your property with the homes available today, not with an old sale or a headline number from another property type.
A competitive market analysis template turns that decision into a repeatable process. It combines MLS® pricing, MLS® HPI benchmarks, the sales-to-active-listings ratio, live competing inventory, documented comparable sales, and relevant rental or presale risks. The result isn't a single “true value”. It's a defensible price range and a strategy for entering the market with the right level of urgency.
A Kitsilano condo and a Main Street townhome may both attract urban buyers, but they don't compete in the same resale pool. Their buyers compare different features, financing implications, strata costs, layouts, and nearby alternatives. A detached home introduces another set of variables, including land value, lot configuration, redevelopment potential, and neighbourhood-specific demand.
That's why a Vancouver CMA should start with segmentation, not a regional average. Greater Vancouver REALTORS® reported 1,869 residential sales, 4,100 new listings, and 15,798 active listings in August 2026, while the Metro Vancouver benchmark price was $1,081,900. The same market snapshot demonstrates why detached homes, apartments, and attached homes need separate analysis rather than one blended conclusion. Greater Vancouver REALTORS® MLS market statistics
Use the workbook as a pricing tool, not as a polished report that gets opened once and forgotten.
MLS HPI anchoring: Select the relevant benchmark category and record the benchmark date. This gives the comparable sales a market context.
Template field design: Capture the subject property, market pressure, active competition, sold comparables, adjustments, and list-price recommendation in separate blocks.
Comparable documentation: Save the MLS information for every sale or listing relied upon, then record why each comparable is relevant and how it differs from the subject.
Worked calculation: Use a transparent price-per-square-foot analysis, attribute adjustments, and a final low, mid, and high list-price range.
The practical value of a CMA in Vancouver real estate is its audit trail. A seller should be able to ask why one sale received more weight than another, why an active listing is a competitive threat, and why the recommended list price sits where it does.
A template also protects your negotiating position. If the list price comes from an outdated peak, a different property class, or a single memorable sale, buyers can challenge the number immediately. If it comes from a documented set of comparable homes and current supply conditions, the pricing conversation becomes more precise.
A seller may point to a neighbour's detached sale while pricing a Vancouver apartment. That comparison can distort the recommendation before the first MLS® comparable is reviewed. Greater Vancouver includes distinct property types, neighbourhoods, and buyer pools, so a simple average can shift because the sales mix changed. The MLS® Home Price Index provides a steadier anchor by tracking a typical property and controlling for differences such as lot size, age, and room count.
For the August 2026 snapshot, record the relevant property-type benchmarks rather than repeating the regional composite from the previous section. Detached homes were $1,799,400, apartments $686,200, and townhouses $1,028,800. See the Vancouver real estate statistics for February 2026 for context on how the benchmark trend has moved. The Metro Vancouver MLS® HPI benchmark figures by property type provide the property-type reference used here.
Use the category that matches the subject property. An apartment CMA should start with the apartment benchmark, while a townhouse CMA should begin with the townhouse category. Then narrow the analysis to the relevant neighbourhood, building profile, and buyer pool. HPI does not replace sold comparables. It keeps a detached trend from being treated as evidence for a condo and gives the comp set a defensible market reference.
The sales-to-active-listings ratio, or SALR, adds current pressure to the HPI anchor. Greater Vancouver REALTORS® market guidance on HPI and SALR describes sustained readings below 12% as a buyers' market and readings above 20% as a sellers' market. Between those levels, track whether inventory is building, days on market are lengthening, and direct competitors are reducing price or improving their terms.
In August 2026, the regional SALR was 12.3%. Sales were 4.6% lower year over year and 20.7% below the 10-year seasonal average, supporting a cautious list-price position rather than automatic optimism.
Use the pressure signal as a decision check, not as a substitute for property-level evidence:
Write the conclusion into the template header: “Apartment benchmark, Vancouver East, benchmark date recorded from MLS HPI, SALR 12.3% for the regional August 2026 context.” That line ties the comparable analysis to the market conditions behind the pricing recommendation.
A useful workbook should let another person understand the pricing logic without sitting through the original appointment. Build it in five blocks, then expand it when the property or buyer pool requires more detail.
Record the address, MLS® listing number when applicable, property type, strata fees, lot size, recent upgrades, and current condition. For a condo, include parking, storage, exposure, floor level, building age, contingency-fund information, depreciation-report status, and any known special levies. For a detached home, add the lot dimensions, lane access, construction era, renovation permits, and redevelopment considerations.
The header should distinguish leasehold from freehold. It should also flag whether the property is tenanted, vacant, owner-occupied, or subject to unusual access restrictions. These details affect which buyers can compete and how confidently a comparable can be adjusted.
The second block records the HPI benchmark category, benchmark date, SALR ratio, and intended list-date snapshot. The template should also identify the micro-market, such as a specific Vancouver West neighbourhood, East Vancouver neighbourhood, or surrounding municipality with a naturally shared buyer pool.
The third block is a live inventory snapshot. Capture competing listings in the subject's price band, their days on market, their current list prices, and any reductions. A listing that appears similar but has a materially lower strata fee, better exposure, or more useful parking should be marked as a serious competitor, not treated as an ordinary listing.
Use columns for:
The final block should show a value range, low/mid/high list-price options, the recommended list price, and an expected net calculation. BC buyers are commonly advised to budget 2% to 4% of the purchase price for total closing costs, with Property Transfer Tax often representing 1% to 3% depending on the bracket and exemptions. BC closing-cost guidance for residential buyers A seller-facing CMA can use this information to discuss buyer affordability and offer conditions, but it shouldn't confuse buyer closing costs with the seller's own net proceeds.
Don't average detached, condo, and townhome sales. Don't ignore strata-document age. Don't treat leasehold and freehold properties as interchangeable. If the subject attracts investors, add columns for rental yield, tenancy restrictions, presale competition, and the likely effect of new supply.
For a deeper pricing framework, see this guide to how to price a Vancouver home. The important point is consistency. A template earns trust when the same fields are captured for the subject and for every competing property.
Start with the buyer pool, then narrow the geography. For a City of Vancouver property, search the relevant Vancouver district and nearby areas only when those homes directly compete for the same buyers. A Yaletown apartment shouldn't be compared casually with a detached home in a distant district just because both fall within a broad city boundary.
Separate the search by condo, townhouse, and detached status. Select sold or closed properties, then apply a defined look-back window that fits the volume and the pace of the micro-market. Add a tight geographic radius, similar interior size, comparable bedroom and bathroom count, similar age, and relevant amenities.
Capture the MLS® listing ID, address, verified sale price, sale date, original list price, days on market, strata fees for condos, lot size, and year built. Save the listing sheet and write the adjustment logic in the notes field while the details are fresh. A last listed price isn't a sale price, and a listing that failed to close shouldn't be treated as a completed transaction.
British Columbia transaction guidance states that a separate summary sheet must be provided in the valuation section for every comparable sale or listing relied upon in developing an opinion of value. BC comparable-sale summary sheet guidance That makes documentation a process requirement, not optional formatting. Attach the relevant summary sheet, verify the completed sale, and explain why the comp belongs in the set.
For a Yaletown one-bedroom condo, select three nearby MLS sales with comparable interior area, building age, parking arrangement, exposure, strata-fee structure, and renovation level. The table below is a working capture sheet. It intentionally leaves sale fields for the live MLS pull rather than inventing values that haven't been verified.
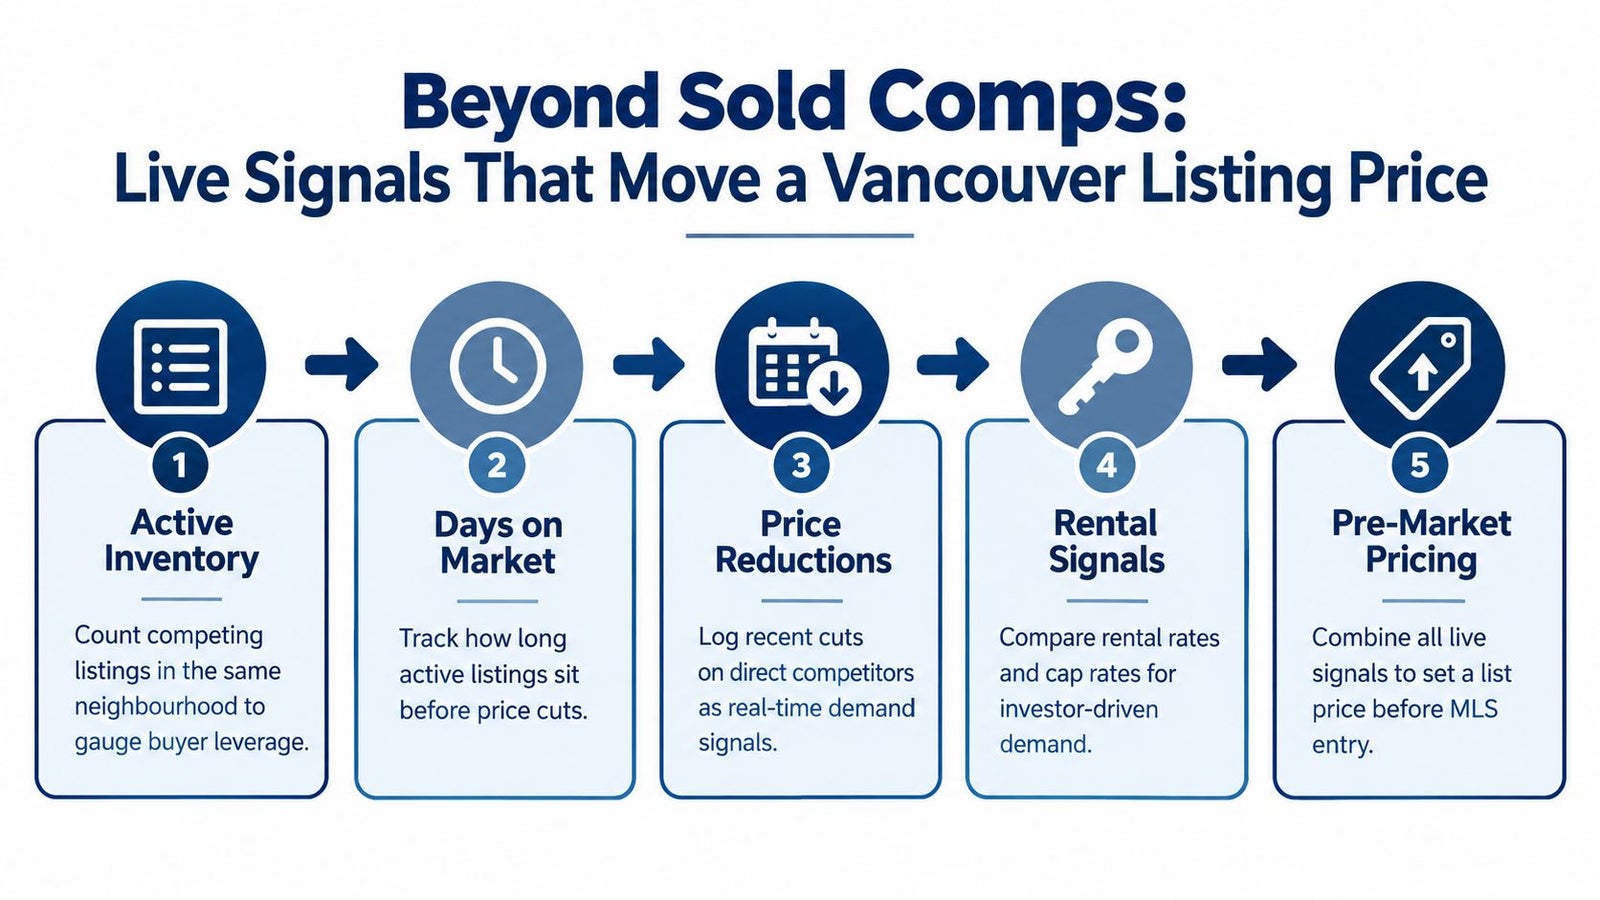
Record competing listings by price band, neighbourhood, property type, and similarity to the subject. For each one, note its active days, any price reduction, and whether its photography, staging, condition, and location present a stronger or weaker alternative.
Use those observations to set the seller's position:
More active inventory: Price near the strongest verified comparable, or improve presentation and terms rather than assuming buyers will wait.
Longer marketing periods: Treat stale listings as evidence that their original positioning failed to attract enough demand.
Frequent reductions: Consider a sharper initial price instead of relying on a later reduction that may reduce buyer confidence.
Lower sale-to-list behaviour: Leave less distance between the asking price and the evidence-backed range.
Rental softness: Test whether an investor can still justify the purchase using likely rent, expenses, and restrictions.
Rental and presale conditions deserve separate fields, especially for condos and townhomes. CMHC reported that Vancouver's vacancy rate rose to its highest level in over 30 years in 2025 and expected vacancy rates to remain high through 2026 to 2028. CMHC's fall 2026 supply report also identified weak presales, high construction costs, and growing inventories of completed and unsold units as constraints on the condominium market. CMHC rental-market reports for major centres
Keep these signals beside, not inside, the sold-comp conclusion. Sold comps establish the evidence base, MLS HPI benchmarks show market direction, and live inventory indicates how firmly the seller can hold the recommended price. Rental and presale conditions add a separate check on investor demand and competing future supply.
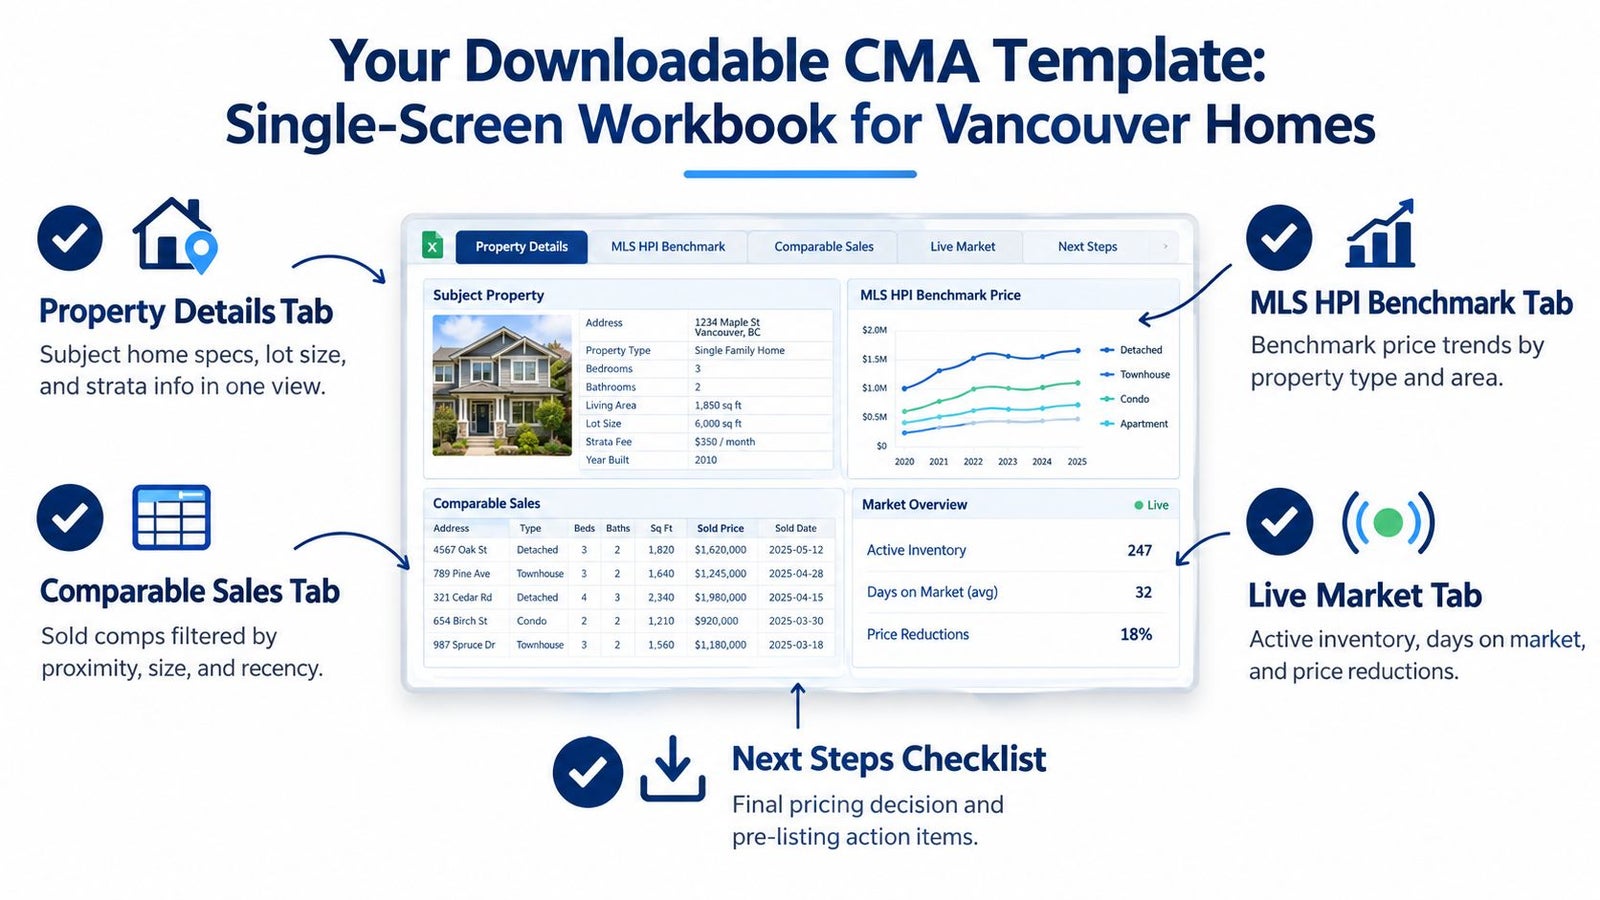
A useful CMA workbook keeps the pricing conclusion visible while storing the evidence in separate tabs. Set it up with Property Details, MLS HPI Benchmark, Comparable Sales, Live Inventory Signals, and Final List-Price Band.
Use the first tab to record the subject property, condition, upgrades, and key features. The benchmark tab identifies the applicable HPI category and valuation date. Preserve MLS IDs, verified sale details, calculations, and adjustments in the comparable-sales tab. Record active competition, days on market, and reductions in the live-market tab. The final tab converts those inputs into low, mid, and high list-price bands, then records the recommended position and the seller's priorities.
Confirm property details: Verify size, bedrooms, bathrooms, parking, storage, lot information, strata fees, upgrades, and condition.
Pull recent MLS comps: Search the last 90 days where local transaction volume supports a useful set. Widen the period only when necessary, and explain why.
Cross-check the HPI category: Match the benchmark to the property type and area instead of relying on a broad regional average.
Review current competition: Count active listings in the neighbourhood and price band. Record days on market and reductions.
Flag market-stack risks: Note rental restrictions, soft rental conditions, presale competition, and unsold new-build inventory where relevant.
Run the calculation: Compare raw and adjusted price per square foot, apply a supported time adjustment, and present a range rather than false precision.
Book a Vancouver CMA with Jacky Levi - Vancouver Realtor to review the property details, comparable sales, HPI benchmark, active competition, and realistic list-price band. Visit Jacky Levi - Vancouver Realtor to request a pricing walkthrough and discuss a template built around live MLS data.
A competitive market analysis template turns that decision into a repeatable process. It combines MLS® pricing, MLS® HPI benchmarks, the sales-to-active-listings ratio, live competing inventory, documented comparable sales, and relevant rental or presale risks. The result isn't a single “true value”. It's a defensible price range and a strategy for entering the market with the right level of urgency.
Why Vancouver Sellers Need a CMA Template Built for MLS Data
A Kitsilano condo and a Main Street townhome may both attract urban buyers, but they don't compete in the same resale pool. Their buyers compare different features, financing implications, strata costs, layouts, and nearby alternatives. A detached home introduces another set of variables, including land value, lot configuration, redevelopment potential, and neighbourhood-specific demand.
That's why a Vancouver CMA should start with segmentation, not a regional average. Greater Vancouver REALTORS® reported 1,869 residential sales, 4,100 new listings, and 15,798 active listings in August 2026, while the Metro Vancouver benchmark price was $1,081,900. The same market snapshot demonstrates why detached homes, apartments, and attached homes need separate analysis rather than one blended conclusion. Greater Vancouver REALTORS® MLS market statistics
Build the template around four layers
Use the workbook as a pricing tool, not as a polished report that gets opened once and forgotten.
MLS HPI anchoring: Select the relevant benchmark category and record the benchmark date. This gives the comparable sales a market context.
Template field design: Capture the subject property, market pressure, active competition, sold comparables, adjustments, and list-price recommendation in separate blocks.
Comparable documentation: Save the MLS information for every sale or listing relied upon, then record why each comparable is relevant and how it differs from the subject.
Worked calculation: Use a transparent price-per-square-foot analysis, attribute adjustments, and a final low, mid, and high list-price range.
The practical value of a CMA in Vancouver real estate is its audit trail. A seller should be able to ask why one sale received more weight than another, why an active listing is a competitive threat, and why the recommended list price sits where it does.
Practical rule: A comp isn't useful because it looks similar in a photo. It's useful because it competes for the same buyer at the same time.
A template also protects your negotiating position. If the list price comes from an outdated peak, a different property class, or a single memorable sale, buyers can challenge the number immediately. If it comes from a documented set of comparable homes and current supply conditions, the pricing conversation becomes more precise.
Anchoring Your Template to MLS HPI Benchmarks and Market Pressure
A seller may point to a neighbour's detached sale while pricing a Vancouver apartment. That comparison can distort the recommendation before the first MLS® comparable is reviewed. Greater Vancouver includes distinct property types, neighbourhoods, and buyer pools, so a simple average can shift because the sales mix changed. The MLS® Home Price Index provides a steadier anchor by tracking a typical property and controlling for differences such as lot size, age, and room count.
For the August 2026 snapshot, record the relevant property-type benchmarks rather than repeating the regional composite from the previous section. Detached homes were $1,799,400, apartments $686,200, and townhouses $1,028,800. See the Vancouver real estate statistics for February 2026 for context on how the benchmark trend has moved. The Metro Vancouver MLS® HPI benchmark figures by property type provide the property-type reference used here.
Use the category that matches the subject property. An apartment CMA should start with the apartment benchmark, while a townhouse CMA should begin with the townhouse category. Then narrow the analysis to the relevant neighbourhood, building profile, and buyer pool. HPI does not replace sold comparables. It keeps a detached trend from being treated as evidence for a condo and gives the comp set a defensible market reference.
Let SALR change the pricing decision
The sales-to-active-listings ratio, or SALR, adds current pressure to the HPI anchor. Greater Vancouver REALTORS® market guidance on HPI and SALR describes sustained readings below 12% as a buyers' market and readings above 20% as a sellers' market. Between those levels, track whether inventory is building, days on market are lengthening, and direct competitors are reducing price or improving their terms.
In August 2026, the regional SALR was 12.3%. Sales were 4.6% lower year over year and 20.7% below the 10-year seasonal average, supporting a cautious list-price position rather than automatic optimism.
Use the pressure signal as a decision check, not as a substitute for property-level evidence:
- Greater Vancouver Residential: Record the regional ratio beside the HPI date. Use it for broad context, not the final value.
- Vancouver West: Compare regional pressure with the Westside buyer pool and select competitors from the same neighbourhood.
- Vancouver East: Check whether local inventory is behaving differently, then give nearby active listings meaningful weight.
- Detached: Separate land, lot, condition, and redevelopment factors from the broader pressure reading.
- Apartment: Compare like-for-like buildings and units, including strata fees, exposure, parking, storage, and building age.
- Townhome: Test the available substitutes by comparing layout, outdoor space, strata obligations, and location.
Write the conclusion into the template header: “Apartment benchmark, Vancouver East, benchmark date recorded from MLS HPI, SALR 12.3% for the regional August 2026 context.” That line ties the comparable analysis to the market conditions behind the pricing recommendation.
The Fields Every CMA Template Should Include
A useful workbook should let another person understand the pricing logic without sitting through the original appointment. Build it in five blocks, then expand it when the property or buyer pool requires more detail.
Start with the property header
Record the address, MLS® listing number when applicable, property type, strata fees, lot size, recent upgrades, and current condition. For a condo, include parking, storage, exposure, floor level, building age, contingency-fund information, depreciation-report status, and any known special levies. For a detached home, add the lot dimensions, lane access, construction era, renovation permits, and redevelopment considerations.
The header should distinguish leasehold from freehold. It should also flag whether the property is tenanted, vacant, owner-occupied, or subject to unusual access restrictions. These details affect which buyers can compete and how confidently a comparable can be adjusted.
Add market context before the comps
The second block records the HPI benchmark category, benchmark date, SALR ratio, and intended list-date snapshot. The template should also identify the micro-market, such as a specific Vancouver West neighbourhood, East Vancouver neighbourhood, or surrounding municipality with a naturally shared buyer pool.
The third block is a live inventory snapshot. Capture competing listings in the subject's price band, their days on market, their current list prices, and any reductions. A listing that appears similar but has a materially lower strata fee, better exposure, or more useful parking should be marked as a serious competitor, not treated as an ordinary listing.
Make the sold-comps block specific
Use columns for:
- Identity: Address, MLS® listing number, sale date, and original list price.
- Physical comparison: Bedrooms, bathrooms, interior area, lot size, year built, floor level, view, parking, and storage.
- Financial result: Sale price, price per square foot, strata fees where relevant, and the verified sale status.
- Adjustment record: Condition, renovations, layout, outdoor space, exposure, and any reason the comp receives more or less weight.
The final block should show a value range, low/mid/high list-price options, the recommended list price, and an expected net calculation. BC buyers are commonly advised to budget 2% to 4% of the purchase price for total closing costs, with Property Transfer Tax often representing 1% to 3% depending on the bracket and exemptions. BC closing-cost guidance for residential buyers A seller-facing CMA can use this information to discuss buyer affordability and offer conditions, but it shouldn't confuse buyer closing costs with the seller's own net proceeds.
Don't average detached, condo, and townhome sales. Don't ignore strata-document age. Don't treat leasehold and freehold properties as interchangeable. If the subject attracts investors, add columns for rental yield, tenancy restrictions, presale competition, and the likely effect of new supply.
For a deeper pricing framework, see this guide to how to price a Vancouver home. The important point is consistency. A template earns trust when the same fields are captured for the subject and for every competing property.
Pulling and Documenting Comps From the MLS
Start with the buyer pool, then narrow the geography. For a City of Vancouver property, search the relevant Vancouver district and nearby areas only when those homes directly compete for the same buyers. A Yaletown apartment shouldn't be compared casually with a detached home in a distant district just because both fall within a broad city boundary.
Use filters that reflect the property
Separate the search by condo, townhouse, and detached status. Select sold or closed properties, then apply a defined look-back window that fits the volume and the pace of the micro-market. Add a tight geographic radius, similar interior size, comparable bedroom and bathroom count, similar age, and relevant amenities.
Capture the MLS® listing ID, address, verified sale price, sale date, original list price, days on market, strata fees for condos, lot size, and year built. Save the listing sheet and write the adjustment logic in the notes field while the details are fresh. A last listed price isn't a sale price, and a listing that failed to close shouldn't be treated as a completed transaction.
British Columbia transaction guidance states that a separate summary sheet must be provided in the valuation section for every comparable sale or listing relied upon in developing an opinion of value. BC comparable-sale summary sheet guidance That makes documentation a process requirement, not optional formatting. Attach the relevant summary sheet, verify the completed sale, and explain why the comp belongs in the set.
Two practical comp pulls
For a Yaletown one-bedroom condo, select three nearby MLS sales with comparable interior area, building age, parking arrangement, exposure, strata-fee structure, and renovation level. The table below is a working capture sheet. It intentionally leaves sale fields for the live MLS pull rather than inventing values that haven't been verified.
For a West Side Cambie-era detached home, use three sales within a tight neighbourhood radius and compare lot size, frontage, lane access, renovation quality, basement configuration, parking, and redevelopment potential. A renovated home on a larger lot may be a useful upper-bound reference, but it shouldn't be presented as a direct match.
The sold-property search and record should support the MLS work, not replace it. At a listing appointment, show the original list price, final sale price, marketing period, and the written adjustment notes. That evidence makes the recommendation easier to defend when the seller prefers a higher number.
Consider a hypothetical 1,050-square-foot, two-bedroom Mount Pleasant condo, two years old, with parking and storage. The example demonstrates the calculation method without pretending that unverified sales are real market evidence. A live CMA must replace every comp field with a completed MLS record and use the apartment benchmark applicable to the subject's area and valuation date.
Select three comparable apartment sales with similar size, age, building quality, parking, storage, exposure, and proximity. For each one, calculate:
Raw $/sq ft = verified sale price ÷ verified interior square footage
Then calculate the raw average and median:
Raw average $/sq ft = total of the three raw $/sq ft figures ÷ 3
Median $/sq ft = middle value after ranking the three raw figures
Do not choose the average automatically. If one comp has an unusually superior view or a materially different building, the median may better represent the central evidence, while the adjusted range explains the difference.
Adjust each comp for floor level, age, view, parking, storage, condition, and strata-fee differences. Use a positive adjustment when the comparable is inferior to the subject and a negative adjustment when it is superior. The adjustment should be supported by the details of the properties and the market evidence available, not by an invented percentage.
The sold-property search and record should support the MLS work, not replace it. At a listing appointment, show the original list price, final sale price, marketing period, and the written adjustment notes. That evidence makes the recommendation easier to defend when the seller prefers a higher number.
A Worked CMA Calculation for a Sample Vancouver Property
Consider a hypothetical 1,050-square-foot, two-bedroom Mount Pleasant condo, two years old, with parking and storage. The example demonstrates the calculation method without pretending that unverified sales are real market evidence. A live CMA must replace every comp field with a completed MLS record and use the apartment benchmark applicable to the subject's area and valuation date.
Select three comparable apartment sales with similar size, age, building quality, parking, storage, exposure, and proximity. For each one, calculate:
Raw $/sq ft = verified sale price ÷ verified interior square footage
Then calculate the raw average and median:
Raw average $/sq ft = total of the three raw $/sq ft figures ÷ 3
Median $/sq ft = middle value after ranking the three raw figures
Do not choose the average automatically. If one comp has an unusually superior view or a materially different building, the median may better represent the central evidence, while the adjusted range explains the difference.
Keep adjustments visible
Adjust each comp for floor level, age, view, parking, storage, condition, and strata-fee differences. Use a positive adjustment when the comparable is inferior to the subject and a negative adjustment when it is superior. The adjustment should be supported by the details of the properties and the market evidence available, not by an invented percentage.
Next, apply the Vancouver apartment MLS HPI time adjustment. The template should record the benchmark category, the benchmark date for each sale, the subject valuation date, and the corresponding HPI movement. The formula is:
Time-adjusted sale price = verified sale price × current apartment HPI factor ÷ comparable-date apartment HPI factor
If a published HPI factor isn't available for a particular comparison, don't manufacture one. Mark the time adjustment for verification and explain that the sale remains a reference point rather than a precise forward-adjusted input.
Choose a primary adjusted price per square foot from the evidence, then multiply it by 1,050 square feet. Present low, mid, and high list-price positions based on the quality of the comp set, current inventory pressure, condition, and the seller's tolerance for time on market. The low position may prioritise a faster response, the mid position may reflect the most defensible evidence, and the high position may require a stronger presentation and willingness to negotiate.
Common errors include double-counting age and condition, assigning a premium for parking without checking whether competing units also include it, and ignoring strata-fee differences. A new building with a high monthly fee may not command the same buyer response as an older building with lower carrying costs, even when the floor plans appear comparable.
A sold comparable records what a buyer accepted under past conditions. It does not show how many similar homes are competing with the subject property on launch day. Active listings, price reductions, and time on market can change the defensible list price before another sale is recorded.
Metro Vancouver inventory remained above seasonal norms in 2026. June new listings were 5.9% above the 10-year average, active listings were 37.9% above the 10-year average in April, and the benchmark price was down 6.9% year over year in April and 6.2% in June. Greater Vancouver REALTORS® June 2026 statistics package In that situation, direct competition deserves as much attention as historical sales.
Time-adjusted sale price = verified sale price × current apartment HPI factor ÷ comparable-date apartment HPI factor
If a published HPI factor isn't available for a particular comparison, don't manufacture one. Mark the time adjustment for verification and explain that the sale remains a reference point rather than a precise forward-adjusted input.
Choose a primary adjusted price per square foot from the evidence, then multiply it by 1,050 square feet. Present low, mid, and high list-price positions based on the quality of the comp set, current inventory pressure, condition, and the seller's tolerance for time on market. The low position may prioritise a faster response, the mid position may reflect the most defensible evidence, and the high position may require a stronger presentation and willingness to negotiate.
Common errors include double-counting age and condition, assigning a premium for parking without checking whether competing units also include it, and ignoring strata-fee differences. A new building with a high monthly fee may not command the same buyer response as an older building with lower carrying costs, even when the floor plans appear comparable.
Beyond Sold Comps: Inventory, Days on Market, and Rental Signals
A sold comparable records what a buyer accepted under past conditions. It does not show how many similar homes are competing with the subject property on launch day. Active listings, price reductions, and time on market can change the defensible list price before another sale is recorded.
Metro Vancouver inventory remained above seasonal norms in 2026. June new listings were 5.9% above the 10-year average, active listings were 37.9% above the 10-year average in April, and the benchmark price was down 6.9% year over year in April and 6.2% in June. Greater Vancouver REALTORS® June 2026 statistics package In that situation, direct competition deserves as much attention as historical sales.
Add the signals that change your negotiating position
Record competing listings by price band, neighbourhood, property type, and similarity to the subject. For each one, note its active days, any price reduction, and whether its photography, staging, condition, and location present a stronger or weaker alternative.
Use those observations to set the seller's position:
More active inventory: Price near the strongest verified comparable, or improve presentation and terms rather than assuming buyers will wait.
Longer marketing periods: Treat stale listings as evidence that their original positioning failed to attract enough demand.
Frequent reductions: Consider a sharper initial price instead of relying on a later reduction that may reduce buyer confidence.
Lower sale-to-list behaviour: Leave less distance between the asking price and the evidence-backed range.
Rental softness: Test whether an investor can still justify the purchase using likely rent, expenses, and restrictions.
Rental and presale conditions deserve separate fields, especially for condos and townhomes. CMHC reported that Vancouver's vacancy rate rose to its highest level in over 30 years in 2025 and expected vacancy rates to remain high through 2026 to 2028. CMHC's fall 2026 supply report also identified weak presales, high construction costs, and growing inventories of completed and unsold units as constraints on the condominium market. CMHC rental-market reports for major centres
Keep these signals beside, not inside, the sold-comp conclusion. Sold comps establish the evidence base, MLS HPI benchmarks show market direction, and live inventory indicates how firmly the seller can hold the recommended price. Rental and presale conditions add a separate check on investor demand and competing future supply.
Your Downloadable Template Mockup and Next Steps
A useful CMA workbook keeps the pricing conclusion visible while storing the evidence in separate tabs. Set it up with Property Details, MLS HPI Benchmark, Comparable Sales, Live Inventory Signals, and Final List-Price Band.
Use the first tab to record the subject property, condition, upgrades, and key features. The benchmark tab identifies the applicable HPI category and valuation date. Preserve MLS IDs, verified sale details, calculations, and adjustments in the comparable-sales tab. Record active competition, days on market, and reductions in the live-market tab. The final tab converts those inputs into low, mid, and high list-price bands, then records the recommended position and the seller's priorities.
Pre-listing checklist
Confirm property details: Verify size, bedrooms, bathrooms, parking, storage, lot information, strata fees, upgrades, and condition.
Pull recent MLS comps: Search the last 90 days where local transaction volume supports a useful set. Widen the period only when necessary, and explain why.
Cross-check the HPI category: Match the benchmark to the property type and area instead of relying on a broad regional average.
Review current competition: Count active listings in the neighbourhood and price band. Record days on market and reductions.
Flag market-stack risks: Note rental restrictions, soft rental conditions, presale competition, and unsold new-build inventory where relevant.
Run the calculation: Compare raw and adjusted price per square foot, apply a supported time adjustment, and present a range rather than false precision.
A Vancouver pricing walkthrough can populate the workbook with current MLS evidence and expose where seller expectations diverge from the market. Jacky Levi - Vancouver Realtor provides comparative market analysis, seller and buyer representation, listing preparation, negotiation, and transaction coordination across Greater Vancouver, including condos, townhomes, detached homes, and investment properties.
Book a Vancouver CMA with Jacky Levi - Vancouver Realtor to review the property details, comparable sales, HPI benchmark, active competition, and realistic list-price band. Visit Jacky Levi - Vancouver Realtor to request a pricing walkthrough and discuss a template built around live MLS data.