
An absorption rate is the share of active listings sold in a month. In Greater Vancouver, the practical local measure is the Sales-to-Active Listings Ratio, or SALR, and the latest benchmark supplied here is 13.0% overall in July 2026, with detached homes at 10.5%, attached homes at 15.8%, and apartments at 14.0%.
You notice absorption when your listing sits while a similar home attracts offers, or when a buyer sees the same inventory appear week after week. The number isn't a pricing shortcut. It's a supply-and-demand gauge that helps explain whether buyers are consuming listings quickly enough to support your expectations.
Six weeks ago, an East Side seller listed a character bungalow at $1.69 million. The first open house was busy, the second was quieter, and by the third, the seller was watching visitors walk through without writing. The conversation had shifted from “Which offer should we accept?” to “Should we reduce the price?”
That's where absorption rate becomes useful. It asks a direct question: how quickly are homes like yours being taken off the market? If the answer is slowly, your listing isn't competing only against today's new properties. It's competing against every unsold listing that has accumulated before it.
BC practitioners commonly use the Sales-to-Active Listings Ratio, or SALR, to measure market tightness. BCREA describes a balanced market as roughly 0.15 to 0.25, or 15% to 25%, and the ratio is a practical proxy for absorption because it compares monthly sales with active inventory. The BCREA Housing Monitor Dashboard is designed for REALTORS® and market monitoring, which reflects how central this supply-demand measure is to professional analysis.
A seller who prices above the demand supported by comparable homes often loses the advantage of a fresh listing. Buyers start asking why the property hasn't sold, and competing sellers gain time to improve their presentation or adjust their price. The result can be longer market exposure, more difficult negotiations, and a reduction that arrives after the property has already developed a stale reputation.
The East Side bungalow may be beautifully renovated, but buyers don't purchase renovation quality in isolation. They compare lot, street, floor plan, condition, financing requirements, and price against the homes currently available. If detached absorption is soft, a seller needs a sharper position than the citywide average suggests.
That's why a seller considering whether now is the right time to sell a Vancouver home should review segment-specific inventory before choosing a list price. The useful question isn't “Is Vancouver hot?” It's “Are buyers absorbing East Side detached homes at a pace that supports this price today?”
The basic calculation is straightforward. Start with the number of homes sold during a defined period, divide it by the number of active listings, and express the result as a monthly percentage. The definition matters because the period, geography, and property type must match.
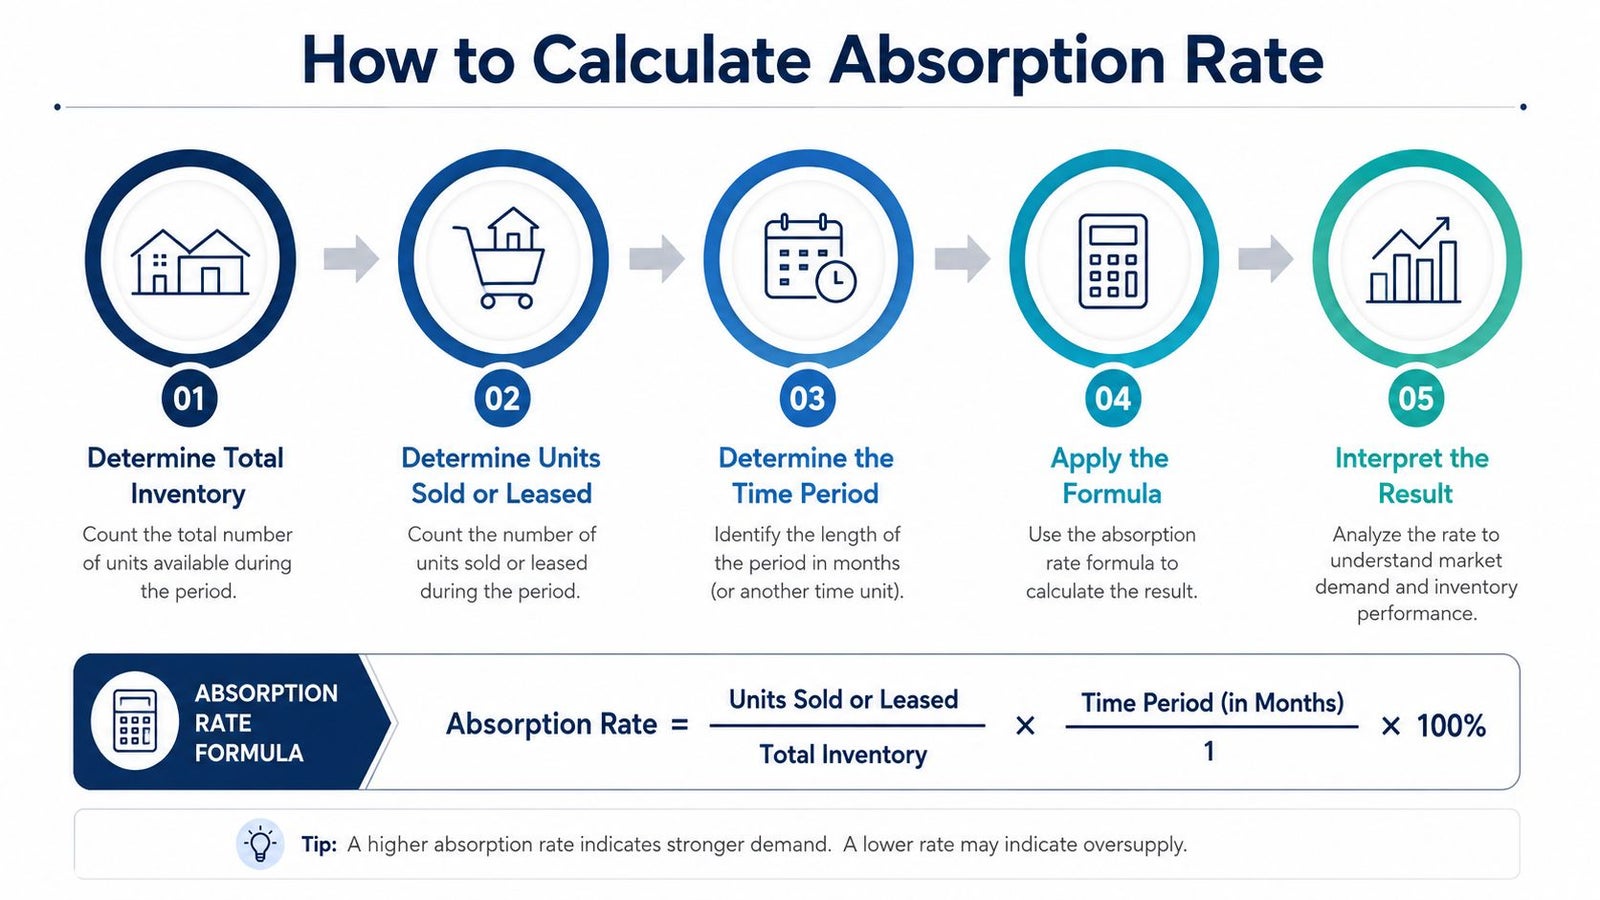
Consider a West Side detached segment with 18 sales and 72 active listings over 30 days.
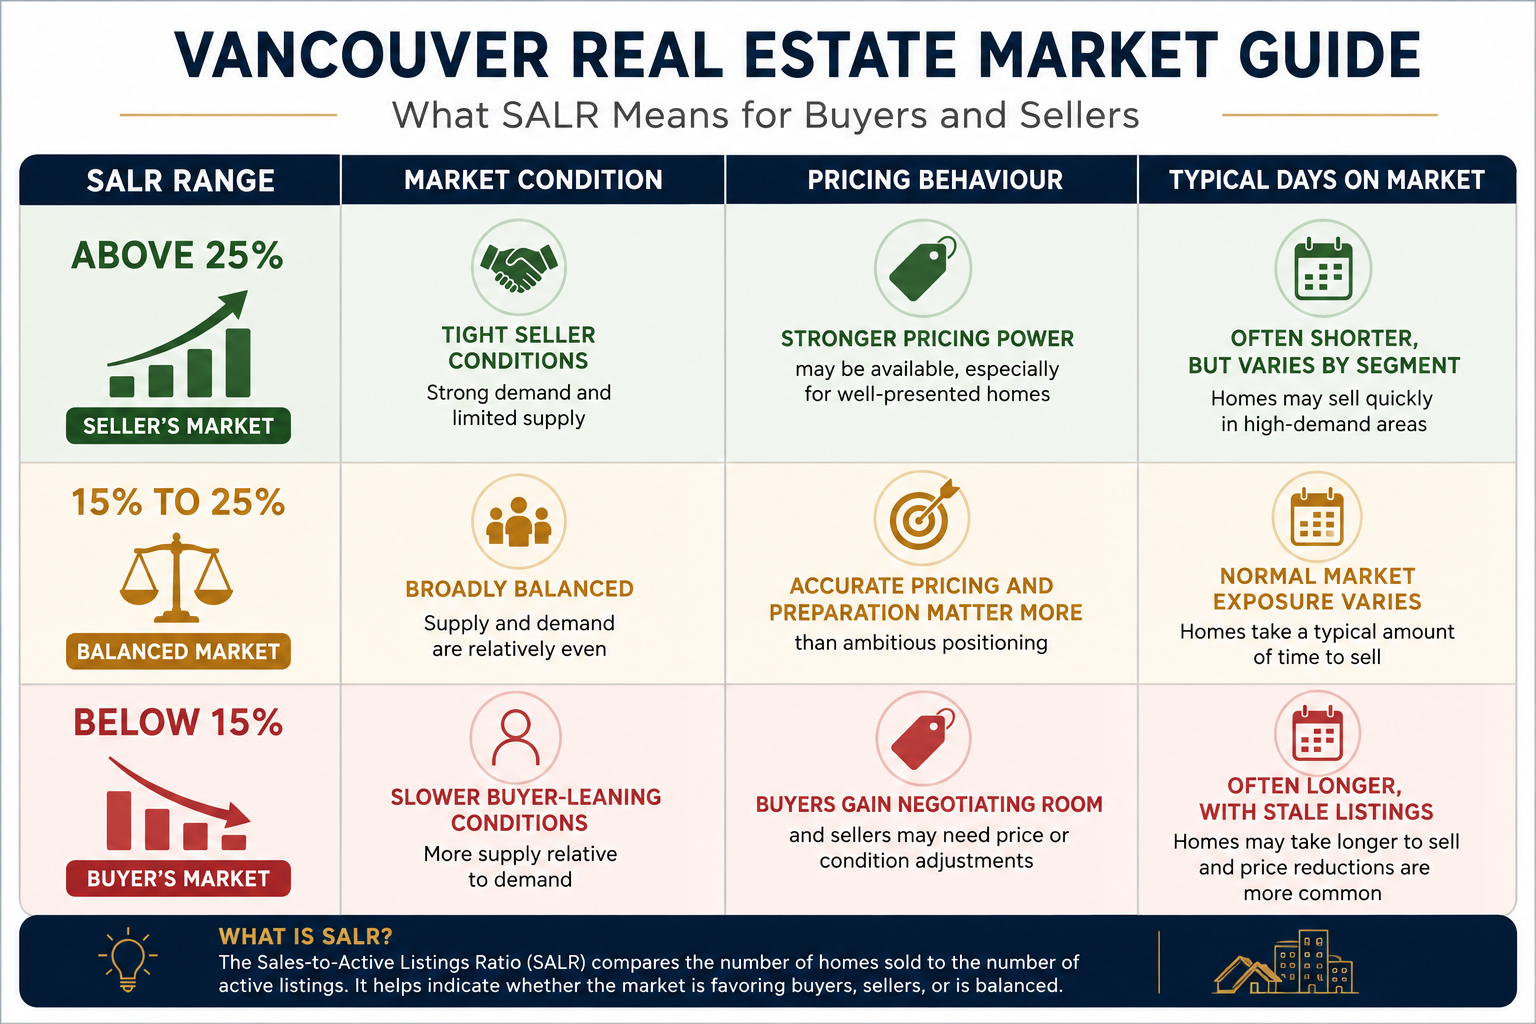
In a tight segment, offer dates can produce multiple bids, clean terms, and limited patience for a seller who wants to wait. In a balanced segment, buyers may still compete for an exceptional home, but ordinary listings need credible pricing and good access. In a slower segment, conditional offers, longer subjects, and price reductions become easier for buyers to request.
A city average can also conceal a sharp neighbourhood difference. Kerrisdale detached homes may behave differently from Main Street apartments, while Metrotown attached properties may have a different buyer pool again. The Vancouver real estate sales update for January 2026 is useful context, but it shouldn't replace a property-type and neighbourhood review.
Use SALR alongside new listings, recent comparable sales, conditional sales, price reductions, and the quality of active inventory. A high ratio with mostly compromised listings can create more opportunity than a lower ratio filled with polished, correctly priced homes.
Greater Vancouver's property types don't move as one market. Detached houses carry different prices, land components, maintenance considerations, and buyer constraints than townhomes or apartments. That means a seller should start with the SALR for the home type, then narrow it by municipality and neighbourhood.
The latest local benchmark in the supplied data reports 13.0% for all property types in July 2026, with detached at 10.5%, attached at 15.8%, and apartments at 14.0%. The attached segment was relatively tighter, while detached homes were the softest of the three. Those figures are more useful than a single average because they show where negotiating power is concentrated. The Greater Vancouver housing data book provides a regional reference point for this kind of analysis.
A detached seller shouldn't respond to a relatively firm apartment market by pricing a house as though buyers have the same urgency. Detached purchasers face a different affordability equation, and a larger home may take longer to match with the right buyer even when apartment demand is active.
Attached homes can sit between the two. A well-located townhouse may attract buyers who have been priced out of detached housing but don't want apartment living. That doesn't make every townhouse a fast sale. Strata fees, layout, parking, school catchment, outdoor space, and condition still determine whether a particular listing benefits from the segment's overall demand.
Apartments require their own filter. Downtown, East Vancouver, Vancouver West, Burnaby, and the Tri-Cities can show different inventory profiles and buyer motivations. A citywide apartment SALR can therefore mislead a seller whose building competes with a very specific group of listings.
The practical sequence is simple: property type first, municipality second, neighbourhood third, building or street fourth. Only then should you decide whether the market is tightening, holding, or losing momentum.
SALR becomes useful at the kitchen table only when it changes a decision. Sellers need to connect the reading to list price, launch timing, preparation, and negotiation posture. Buyers need to connect it to the terms they're willing to offer and the amount of competition they can tolerate.
Suppose a Kitsilano condo segment is showing a reading above the balanced range, with a clean, well-presented listing competing near the upper end of recent comparable sales. That may justify testing the stronger end of the range, provided the unit has the light, outlook, layout, parking, storage, and building condition buyers are currently rewarding. It doesn't justify choosing an aspirational number just because one nearby property sold well.
A West Vancouver detached segment with a low reading calls for a different approach. Price needs to acknowledge the latest credible comparable sale rather than the seller's preferred valuation, and the offer strategy should anticipate that buyers may test conditions, completion dates, and inclusions.
For buyers, a tighter segment may require a clean offer, an escalation structure where appropriate, or carefully considered conditions. A slower segment can allow more room for inspection, financing review, inclusions, and a longer completion. Waiving protections merely to appear competitive can create unacceptable risk, so the SALR should inform the offer rather than override due diligence.
The home pricing guidance from Jacky Levi frames pricing as a market-positioning decision grounded in comparable data. That's the right lens. Absorption tells you how much urgency exists; property-specific evidence tells you how to capture it.
Attached housing may tighten first when buyers seek an alternative to detached prices. Some buyers then move into apartments, while others leave the search because the available homes don't fit their budget or needs. If apartment inventory grows through new completions while resale demand weakens, the apartment SALR can soften even as attached homes remain comparatively firm.
That's why absorption can help frame a three-to-six-month view of price direction by property type, but it isn't a promise. The CMHC Housing Market Outlook and BCREA market activity reporting provide broader context for changing resale and sales conditions, while local monthly readings show how those changes are appearing on the ground.
Track your segment monthly and watch the direction, not just the latest reading. A rising ratio paired with falling active inventory is a different signal from a rising ratio caused by a temporary sales dip in a very small sample.
For a condo owner deciding how long it takes to sell a Vancouver condo, the useful question is whether apartment absorption is improving relative to its own recent pattern. The media may still describe the city broadly, but a segment-level shift can change your pricing and timing conversation first.
Use this checklist before pricing a detached home in Kitsilano, an attached townhouse in Burnaby, or an apartment downtown. Public market dashboards and reports can provide the starting data, but the interpretation must stay local.
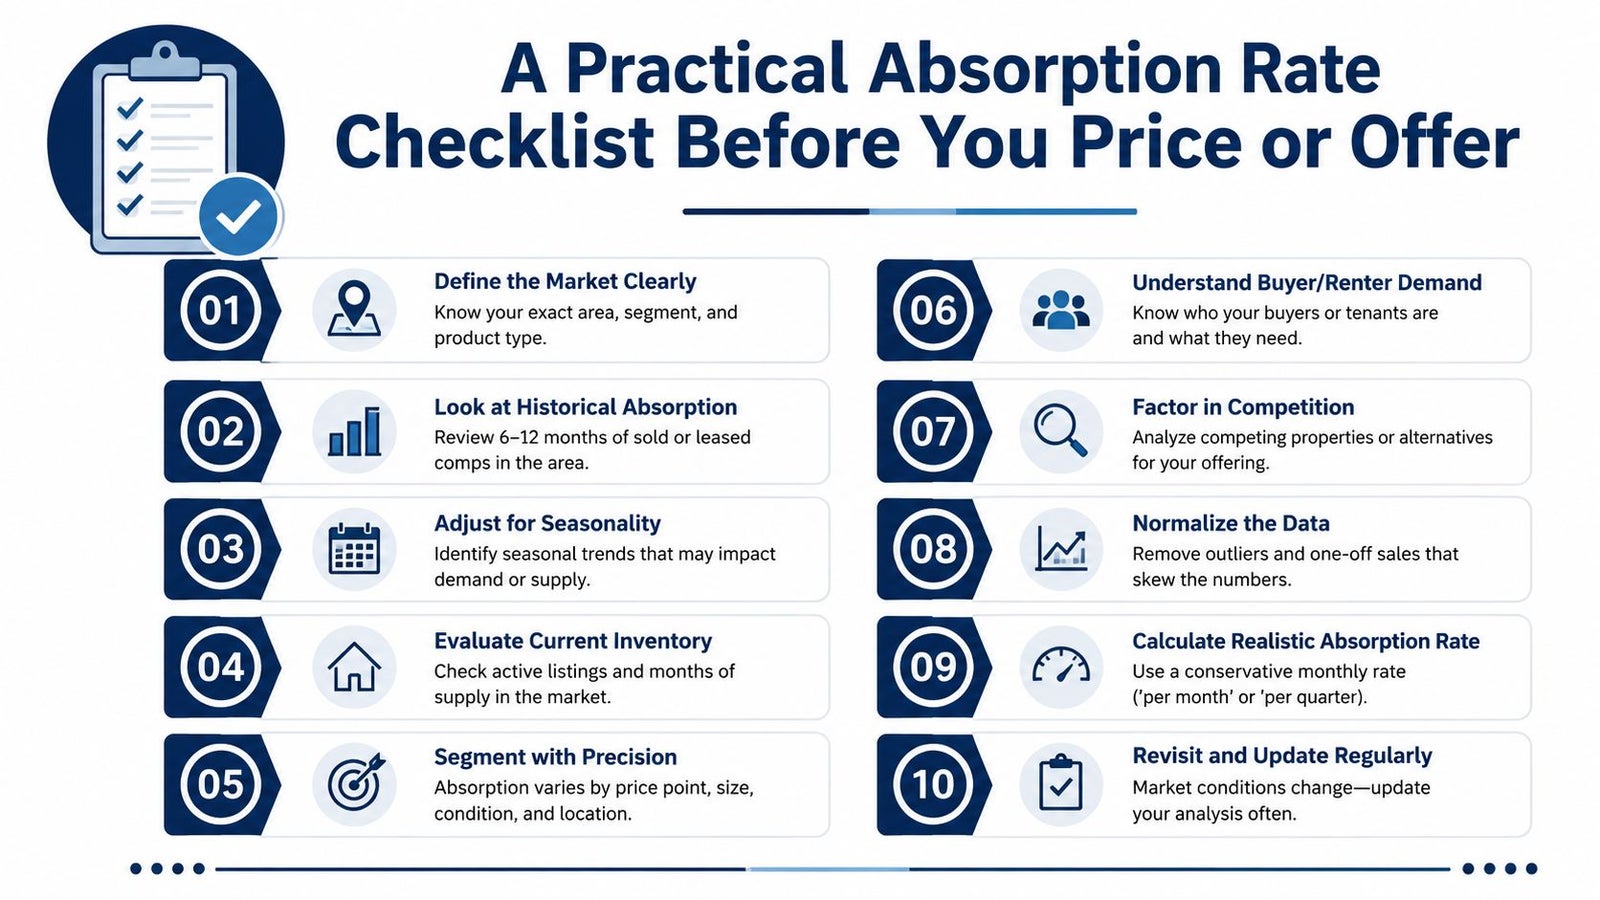
Pull the current SALR: Start with the latest Greater Vancouver monthly housing report or the applicable BCREA housing report.
Filter by property type: Use detached, attached, or apartment data instead of relying on the board-wide figure.
Narrow the geography: Separate Vancouver West, Vancouver East, Burnaby, Richmond, North Vancouver, and the Tri-Cities where the data allows.
Check the trend: Compare the latest segment sales count with the count from the same month one year earlier to see whether activity is strengthening, softening, or flat. Treat the comparison as a directional check, not a complete market analysis.
Review active inventory: Look at the number and quality of competing listings, including reductions and relisted properties.
Measure recent supply: Compare new listings with total sales over the trailing 90 days to see whether inventory is being replenished faster than buyers are absorbing it.
Estimate months of inventory: Use segment inventory and sales pace to understand how long the available supply could last if current conditions persist.
Check price per square foot: Review the direction of price-per-square-foot trends alongside comparable sales, not as a replacement for them.
Apply the bands carefully: BCREA's balanced SALR range is roughly 15% to 25%, but the property type and neighbourhood may behave differently.
Call before making the move: Speak with a local REALTOR when the segment reading conflicts with the headline market, when a listing has gone stale, or when you're deciding whether to reduce price, offer aggressively, or wait.
The Greater Vancouver REALTORS® market reporting and BCREA housing reports can help readers monitor sales, listings, and market balance. CMHC's regional absorption tables are particularly useful for comparing Canadian, provincial, CMA, and large Census Agglomeration conditions, including newly built housing by dwelling type and municipality.
Keep three resources readily available: the REBGV Monthly Housing Report, BCREA Housing Reports, and the Housing Market Report on Greater Vancouver boards. Public dashboards may not require a login, but they still won't tell you whether a specific bungalow has a structural issue, whether a condo building is being discounted by buyers, or whether the best competing townhouse has just accepted an offer.
That's the point where professional analysis earns its place. A percentage can identify the direction. A property-level review determines the price, preparation, timing, and terms that fit the opportunity.
Jacky Levi - Sotheby's Realty Advisor & Realtor offers MLS-based comparative market analysis, listing preparation, marketing coordination, and buyer or seller representation across Greater Vancouver. Visit Jacky Levi - Sotheby's Realty Advisor & Realtor to review your property type's absorption, understand the current competing inventory, and plan a pricing or offer strategy based on local evidence.
You notice absorption when your listing sits while a similar home attracts offers, or when a buyer sees the same inventory appear week after week. The number isn't a pricing shortcut. It's a supply-and-demand gauge that helps explain whether buyers are consuming listings quickly enough to support your expectations.
Why Absorption Rate Matters to a Vancouver Seller
Six weeks ago, an East Side seller listed a character bungalow at $1.69 million. The first open house was busy, the second was quieter, and by the third, the seller was watching visitors walk through without writing. The conversation had shifted from “Which offer should we accept?” to “Should we reduce the price?”
That's where absorption rate becomes useful. It asks a direct question: how quickly are homes like yours being taken off the market? If the answer is slowly, your listing isn't competing only against today's new properties. It's competing against every unsold listing that has accumulated before it.
BC practitioners commonly use the Sales-to-Active Listings Ratio, or SALR, to measure market tightness. BCREA describes a balanced market as roughly 0.15 to 0.25, or 15% to 25%, and the ratio is a practical proxy for absorption because it compares monthly sales with active inventory. The BCREA Housing Monitor Dashboard is designed for REALTORS® and market monitoring, which reflects how central this supply-demand measure is to professional analysis.
The cost of ignoring the signal
A seller who prices above the demand supported by comparable homes often loses the advantage of a fresh listing. Buyers start asking why the property hasn't sold, and competing sellers gain time to improve their presentation or adjust their price. The result can be longer market exposure, more difficult negotiations, and a reduction that arrives after the property has already developed a stale reputation.
The East Side bungalow may be beautifully renovated, but buyers don't purchase renovation quality in isolation. They compare lot, street, floor plan, condition, financing requirements, and price against the homes currently available. If detached absorption is soft, a seller needs a sharper position than the citywide average suggests.
Practical rule: Absorption tells you how much demand exists for your property type. Comparable sales tell you where that demand is willing to transact.
That's why a seller considering whether now is the right time to sell a Vancouver home should review segment-specific inventory before choosing a list price. The useful question isn't “Is Vancouver hot?” It's “Are buyers absorbing East Side detached homes at a pace that supports this price today?”
How to Calculate Absorption Rate Step by Step
The basic calculation is straightforward. Start with the number of homes sold during a defined period, divide it by the number of active listings, and express the result as a monthly percentage. The definition matters because the period, geography, and property type must match.
The classic calculation
Consider a West Side detached segment with 18 sales and 72 active listings over 30 days.
- Count completed sales: There were 18 detached homes sold during the period.
- Count active inventory: There were 72 detached homes available.
- Divide sales by listings: 18 divided by 72 equals 0.25.
- Convert to a percentage: 0.25 becomes 25% monthly absorption.
- Interpret the result: One quarter of the active inventory was sold during that month, assuming the figures describe the same segment and period.
That calculation gives a useful snapshot, but it can become misleading if the denominator is poorly chosen. Mixing detached, attached, and apartment listings creates a citywide figure that may not describe any individual seller's competition.
BCREA's Sales-to-Active Listings Ratio uses the same core relationship: monthly sales divided by total active listings, expressed as a percentage. Using the example above, the SALR is also 25%, because the 18 sales are measured against 72 active listings.
The CMHC Market Absorption Statistics framework provides regional data across Canada, provinces, CMAs, and large Census Agglomerations. Its absorbed-units tables can also distinguish newly built homes by price range, dwelling type, and municipality, which is valuable when broad market data hides the difference between an apartment and a detached house.
Before using any result, confirm four things:
A higher SALR generally means buyers are removing available homes faster. That can support firmer pricing, shorter marketing periods, and more seller control over dates and conditions. A lower SALR usually means listings remain available longer, buyers have more alternatives, and sellers need to compete on price and presentation.
BCREA's practical balanced range is roughly 15% to 25%, as reflected in its discussion of market tightness and SALR through BCREA's market guidance. These bands aren't laws. They're a starting point for interpreting the behaviour visible in a neighbourhood.
The BC practitioner version
BCREA's Sales-to-Active Listings Ratio uses the same core relationship: monthly sales divided by total active listings, expressed as a percentage. Using the example above, the SALR is also 25%, because the 18 sales are measured against 72 active listings.
The CMHC Market Absorption Statistics framework provides regional data across Canada, provinces, CMAs, and large Census Agglomerations. Its absorbed-units tables can also distinguish newly built homes by price range, dwelling type, and municipality, which is valuable when broad market data hides the difference between an apartment and a detached house.
Before using any result, confirm four things:
- Same geography: Don't compare Vancouver West sales with all of Metro Vancouver inventory.
- Same property type: Detached, attached, and apartments need separate calculations.
- Same period: Monthly sales should be matched with the active inventory for that period.
- Same market definition: Resale and newly built housing may require different data sets.
What Absorption Numbers Reveal About Market Balance
A higher SALR generally means buyers are removing available homes faster. That can support firmer pricing, shorter marketing periods, and more seller control over dates and conditions. A lower SALR usually means listings remain available longer, buyers have more alternatives, and sellers need to compete on price and presentation.
BCREA's practical balanced range is roughly 15% to 25%, as reflected in its discussion of market tightness and SALR through BCREA's market guidance. These bands aren't laws. They're a starting point for interpreting the behaviour visible in a neighbourhood.
What buyers and sellers actually notice
In a tight segment, offer dates can produce multiple bids, clean terms, and limited patience for a seller who wants to wait. In a balanced segment, buyers may still compete for an exceptional home, but ordinary listings need credible pricing and good access. In a slower segment, conditional offers, longer subjects, and price reductions become easier for buyers to request.
A city average can also conceal a sharp neighbourhood difference. Kerrisdale detached homes may behave differently from Main Street apartments, while Metrotown attached properties may have a different buyer pool again. The Vancouver real estate sales update for January 2026 is useful context, but it shouldn't replace a property-type and neighbourhood review.
A balanced citywide reading doesn't mean every listing is balanced. Your competition is defined by the homes a buyer can actually substitute for yours.
Use SALR alongside new listings, recent comparable sales, conditional sales, price reductions, and the quality of active inventory. A high ratio with mostly compromised listings can create more opportunity than a lower ratio filled with polished, correctly priced homes.
Reading Absorption by Property Type in Greater Vancouver
Greater Vancouver's property types don't move as one market. Detached houses carry different prices, land components, maintenance considerations, and buyer constraints than townhomes or apartments. That means a seller should start with the SALR for the home type, then narrow it by municipality and neighbourhood.
The latest local benchmark in the supplied data reports 13.0% for all property types in July 2026, with detached at 10.5%, attached at 15.8%, and apartments at 14.0%. The attached segment was relatively tighter, while detached homes were the softest of the three. Those figures are more useful than a single average because they show where negotiating power is concentrated. The Greater Vancouver housing data book provides a regional reference point for this kind of analysis.
How to use the segment reading
A detached seller shouldn't respond to a relatively firm apartment market by pricing a house as though buyers have the same urgency. Detached purchasers face a different affordability equation, and a larger home may take longer to match with the right buyer even when apartment demand is active.
Attached homes can sit between the two. A well-located townhouse may attract buyers who have been priced out of detached housing but don't want apartment living. That doesn't make every townhouse a fast sale. Strata fees, layout, parking, school catchment, outdoor space, and condition still determine whether a particular listing benefits from the segment's overall demand.
Apartments require their own filter. Downtown, East Vancouver, Vancouver West, Burnaby, and the Tri-Cities can show different inventory profiles and buyer motivations. A citywide apartment SALR can therefore mislead a seller whose building competes with a very specific group of listings.
The practical sequence is simple: property type first, municipality second, neighbourhood third, building or street fourth. Only then should you decide whether the market is tightening, holding, or losing momentum.
Turning the Number Into a Real Pricing and Offer Strategy
SALR becomes useful at the kitchen table only when it changes a decision. Sellers need to connect the reading to list price, launch timing, preparation, and negotiation posture. Buyers need to connect it to the terms they're willing to offer and the amount of competition they can tolerate.
Suppose a Kitsilano condo segment is showing a reading above the balanced range, with a clean, well-presented listing competing near the upper end of recent comparable sales. That may justify testing the stronger end of the range, provided the unit has the light, outlook, layout, parking, storage, and building condition buyers are currently rewarding. It doesn't justify choosing an aspirational number just because one nearby property sold well.
A West Vancouver detached segment with a low reading calls for a different approach. Price needs to acknowledge the latest credible comparable sale rather than the seller's preferred valuation, and the offer strategy should anticipate that buyers may test conditions, completion dates, and inclusions.
Seller decisions that follow the data
- List price: Position against current competing inventory, not only past sales. A lower absorption reading makes overpricing harder to recover from.
- Launch preparation: Professional photography, staging, floor plans, and a clear showing schedule matter more when buyers have alternatives.
- Week-three review: If feedback is consistent and offers haven't materialized, refresh the photos, adjust presentation, or reconsider price rather than waiting without a plan.
- Pause and relist: This can be appropriate when the segment is improving, and the property needs a different launch, not merely a new listing date with the same price and presentation.
For buyers, a tighter segment may require a clean offer, an escalation structure where appropriate, or carefully considered conditions. A slower segment can allow more room for inspection, financing review, inclusions, and a longer completion. Waiving protections merely to appear competitive can create unacceptable risk, so the SALR should inform the offer rather than override due diligence.
The home pricing guidance from Jacky Levi frames pricing as a market-positioning decision grounded in comparable data. That's the right lens. Absorption tells you how much urgency exists; property-specific evidence tells you how to capture it.
The most important review isn't a single percentage. It's the combination of SALR, competing listings, recent sales, buyer feedback, and the time your property has already spent exposed to the market.
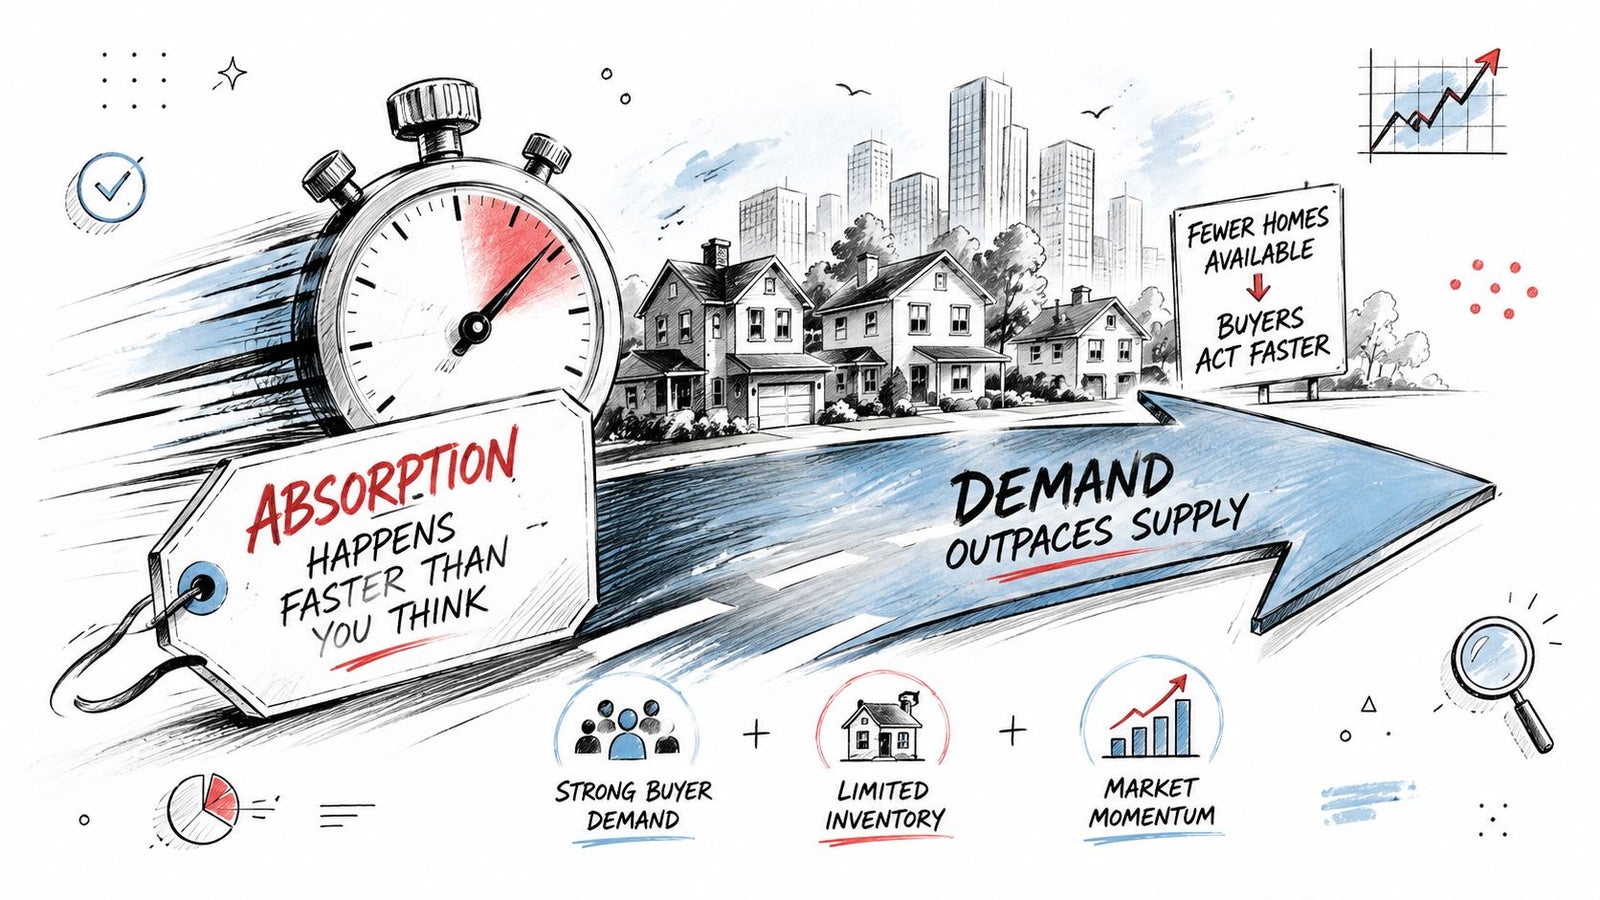
Absorption is a living indicator, not a quarterly label. Inventory can accumulate, sellers can withdraw, new listings can arrive, and buyers can move between property types. A segment that looks slow in one month may be tightening before broad headlines acknowledge the change.
The verified local outlook includes a useful rotation example. A segment's SALR can move from 11% to 19% inside ten weeks as inventory thins into spring. That is a meaningful change in negotiating conditions, but it doesn't mean every property suddenly deserves a higher price. It means the balance between available supply and completed sales has shifted, and the next comparable set may look different.
Why Absorption Shifts Faster Than Most Buyers Realize
Absorption is a living indicator, not a quarterly label. Inventory can accumulate, sellers can withdraw, new listings can arrive, and buyers can move between property types. A segment that looks slow in one month may be tightening before broad headlines acknowledge the change.
The verified local outlook includes a useful rotation example. A segment's SALR can move from 11% to 19% inside ten weeks as inventory thins into spring. That is a meaningful change in negotiating conditions, but it doesn't mean every property suddenly deserves a higher price. It means the balance between available supply and completed sales has shifted, and the next comparable set may look different.
The rotation between segments
Attached housing may tighten first when buyers seek an alternative to detached prices. Some buyers then move into apartments, while others leave the search because the available homes don't fit their budget or needs. If apartment inventory grows through new completions while resale demand weakens, the apartment SALR can soften even as attached homes remain comparatively firm.
That's why absorption can help frame a three-to-six-month view of price direction by property type, but it isn't a promise. The CMHC Housing Market Outlook and BCREA market activity reporting provide broader context for changing resale and sales conditions, while local monthly readings show how those changes are appearing on the ground.
Track your segment monthly and watch the direction, not just the latest reading. A rising ratio paired with falling active inventory is a different signal from a rising ratio caused by a temporary sales dip in a very small sample.
For a condo owner deciding how long it takes to sell a Vancouver condo, the useful question is whether apartment absorption is improving relative to its own recent pattern. The media may still describe the city broadly, but a segment-level shift can change your pricing and timing conversation first.
A Practical Absorption Rate Checklist Before You Price or Offer
Use this checklist before pricing a detached home in Kitsilano, an attached townhouse in Burnaby, or an apartment downtown. Public market dashboards and reports can provide the starting data, but the interpretation must stay local.
Gather the right monthly evidence
Pull the current SALR: Start with the latest Greater Vancouver monthly housing report or the applicable BCREA housing report.
Filter by property type: Use detached, attached, or apartment data instead of relying on the board-wide figure.
Narrow the geography: Separate Vancouver West, Vancouver East, Burnaby, Richmond, North Vancouver, and the Tri-Cities where the data allows.
Check the trend: Compare the latest segment sales count with the count from the same month one year earlier to see whether activity is strengthening, softening, or flat. Treat the comparison as a directional check, not a complete market analysis.
Review active inventory: Look at the number and quality of competing listings, including reductions and relisted properties.
Measure recent supply: Compare new listings with total sales over the trailing 90 days to see whether inventory is being replenished faster than buyers are absorbing it.
Estimate months of inventory: Use segment inventory and sales pace to understand how long the available supply could last if current conditions persist.
Check price per square foot: Review the direction of price-per-square-foot trends alongside comparable sales, not as a replacement for them.
Apply the bands carefully: BCREA's balanced SALR range is roughly 15% to 25%, but the property type and neighbourhood may behave differently.
Call before making the move: Speak with a local REALTOR when the segment reading conflicts with the headline market, when a listing has gone stale, or when you're deciding whether to reduce price, offer aggressively, or wait.
Bookmark the data sources
The Greater Vancouver REALTORS® market reporting and BCREA housing reports can help readers monitor sales, listings, and market balance. CMHC's regional absorption tables are particularly useful for comparing Canadian, provincial, CMA, and large Census Agglomeration conditions, including newly built housing by dwelling type and municipality.
Keep three resources readily available: the REBGV Monthly Housing Report, BCREA Housing Reports, and the Housing Market Report on Greater Vancouver boards. Public dashboards may not require a login, but they still won't tell you whether a specific bungalow has a structural issue, whether a condo building is being discounted by buyers, or whether the best competing townhouse has just accepted an offer.
That's the point where professional analysis earns its place. A percentage can identify the direction. A property-level review determines the price, preparation, timing, and terms that fit the opportunity.
Jacky Levi - Sotheby's Realty Advisor & Realtor offers MLS-based comparative market analysis, listing preparation, marketing coordination, and buyer or seller representation across Greater Vancouver. Visit Jacky Levi - Sotheby's Realty Advisor & Realtor to review your property type's absorption, understand the current competing inventory, and plan a pricing or offer strategy based on local evidence.